

Question: Shown is a partial computer output from a regression analysis: 23 16 14 38 28 22 24 Regression Analysis: y versus x1, x2, x3 The
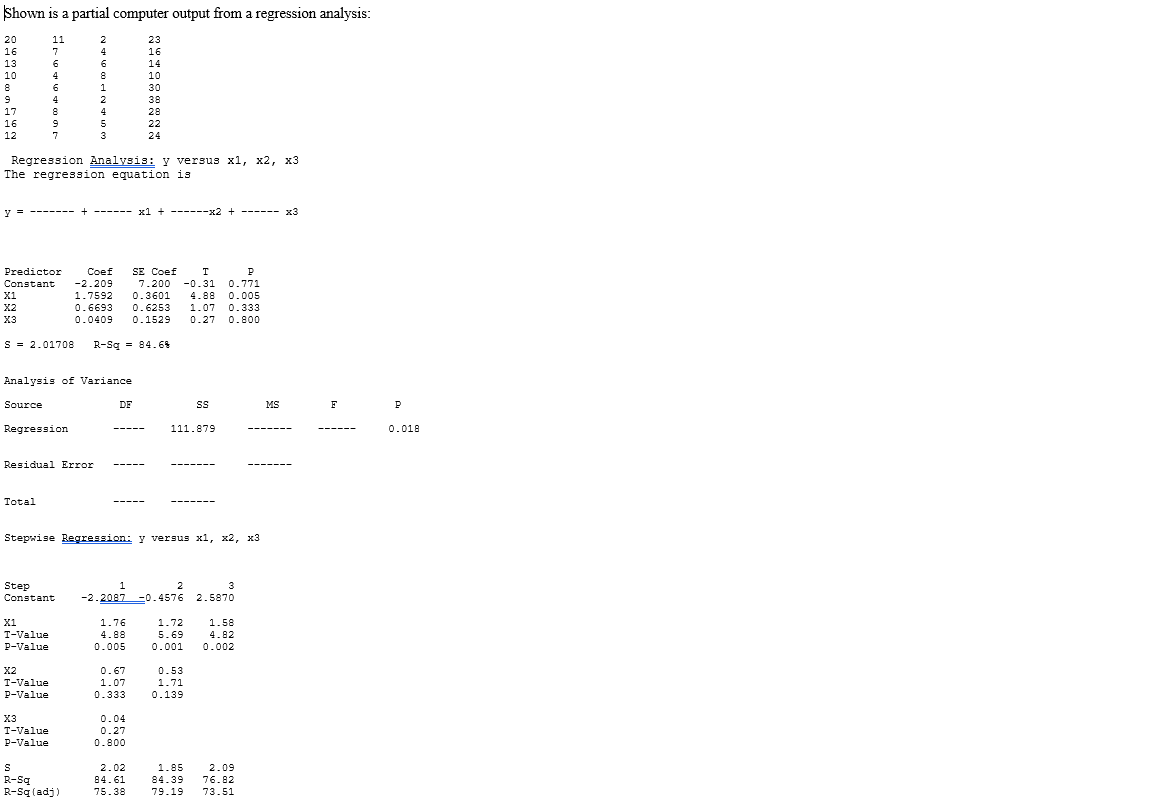
Shown is a partial computer output from a regression analysis: 23 16 14 38 28 22 24 Regression Analysis: y versus x1, x2, x3 The regression equation is -- x1 + --x2 + --- x3 Predictor Coef SE Coef T P Constant -2.209 7.200 -0-31 X1 1.7592 0. 3601 4.98 0. 771 0.005 X2 0. 6693 0 . 6253 1.07 0.333 0 .0409 0. 1529 0.27 0. 800 5 = 2.01708 R-Sg = 84.69 Analysis of Variance Source DF 5S MS Regression 111 . 879 0 . 018 Residual Error Total Stepwise Regression: y versus x1, x2, x3 Step 1 2 -2.2087 3 Constant -0. 4576 2.5870 X1 1. 12 1.58 T-Value 4 . 88 5.69 4.82 P-Value 0.005 0. 001 0.002 X2 0.6 0.53 I-Value 1 . 07 1.71 P-Value 0.333 0.139 X3 0 . 04 T-Value 0.27 P-Value 0 . 800 S 2.02 1-85 2-09 R-Sq R-Sq(adj ) 84. 61 75.38 84.39 79-19 76 . 8 3.51
Step by Step Solution
There are 3 Steps involved in it

Get step-by-step solutions from verified subject matter experts