

Question: Shown to the right are the histogram and summary statistics for the number of camp sites at public parks in a particular state. Use
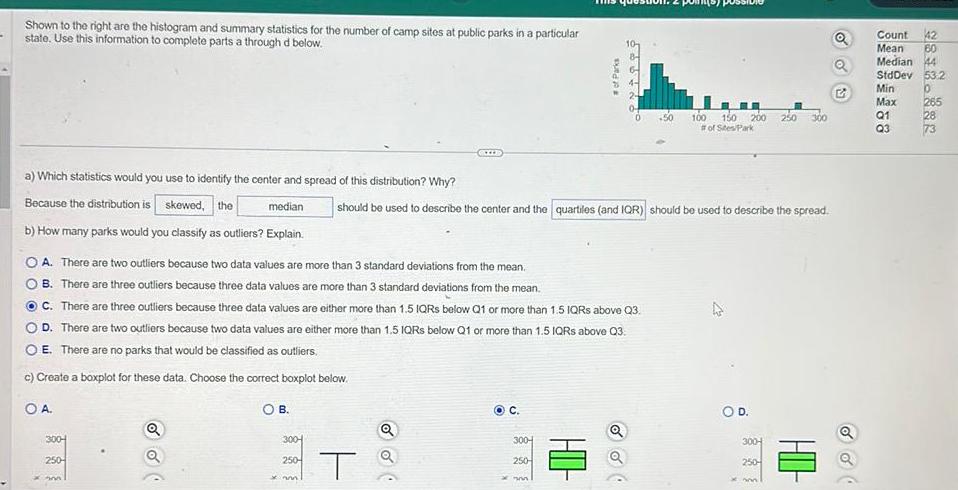
Shown to the right are the histogram and summary statistics for the number of camp sites at public parks in a particular state. Use this information to complete parts a through d below. # of Parks 97 +999 100 200 150 # of Sites Park 250 300 57 a) Which statistics would you use to identify the center and spread of this distribution? Why? Because the distribution is skewed, the median b) How many parks would you classify as outliers? Explain. should be used to describe the center and the quartiles (and IQR) should be used to describe the spread. OA. There are two outliers because two data values are more than 3 standard deviations from the mean. B. There are three outliers because three data values are more than 3 standard deviations from the mean. C. There are three outliers because three data values are either more than 1.5 IQRS below Q1 or more than 1.5 IQRS above Q3. D. There are two outliers because two data values are either more than 1.5 IQRS below Q1 or more than 1.5 IQRS above Q3: OE. There are no parks that would be classified as outliers. c) Create a boxplot for these data. Choose the correct boxplot below. O A. 300- 250- OB. C. Q 300- 300- 250- T 250 HD- O D. a 300- 250- xm HO Count 42 Mean 60 Median 44 StdDev 53.2 Min 0 Max 265 Q1 28 Q3 73
Step by Step Solution
There are 3 Steps involved in it

Get step-by-step solutions from verified subject matter experts