

Question: Shrek Casting Company is considering adding a new line to its product mix. The production line would be set up in unused space in Shrek's
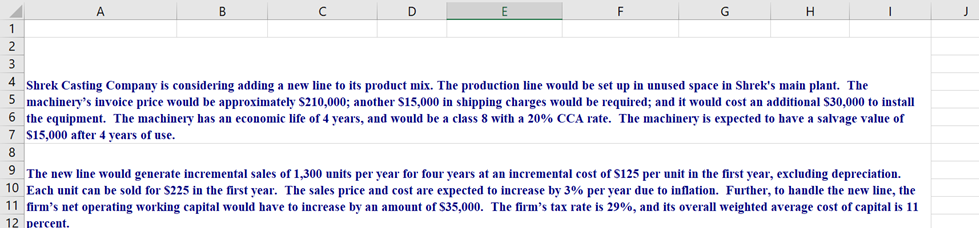
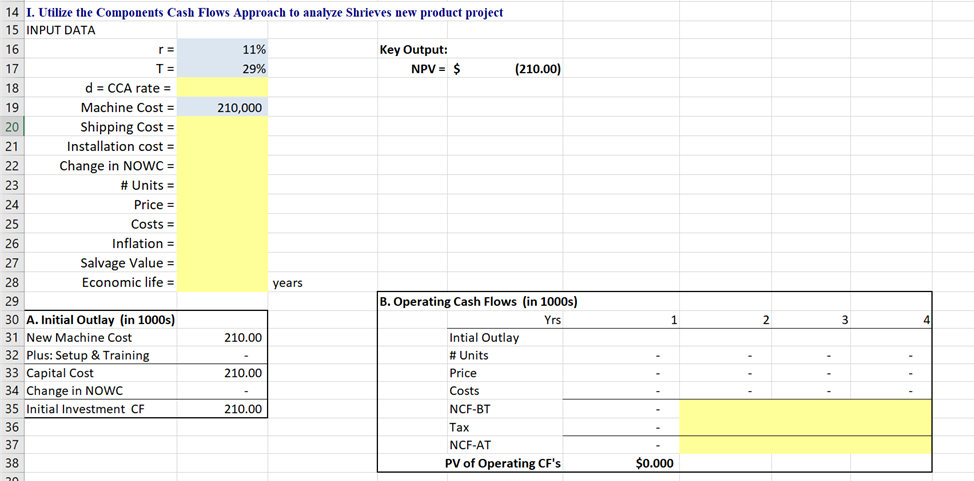
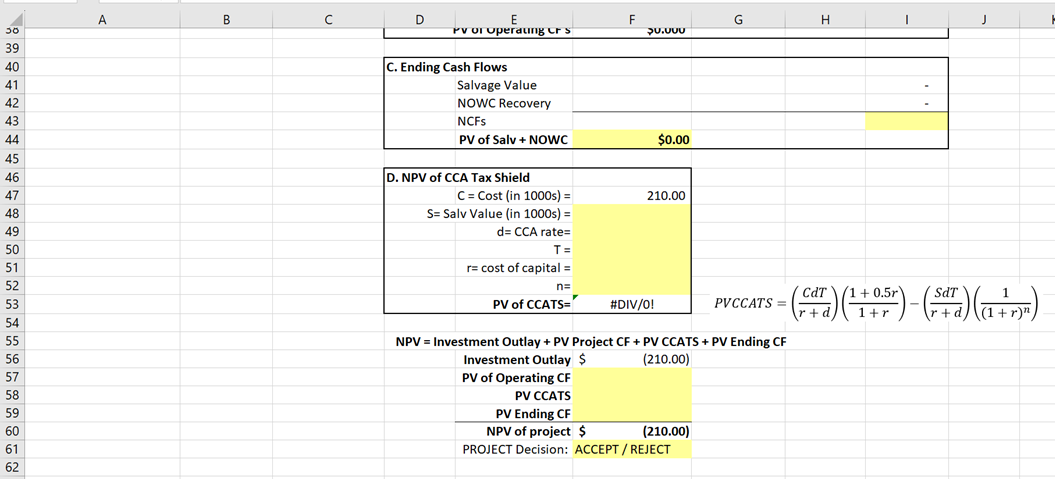
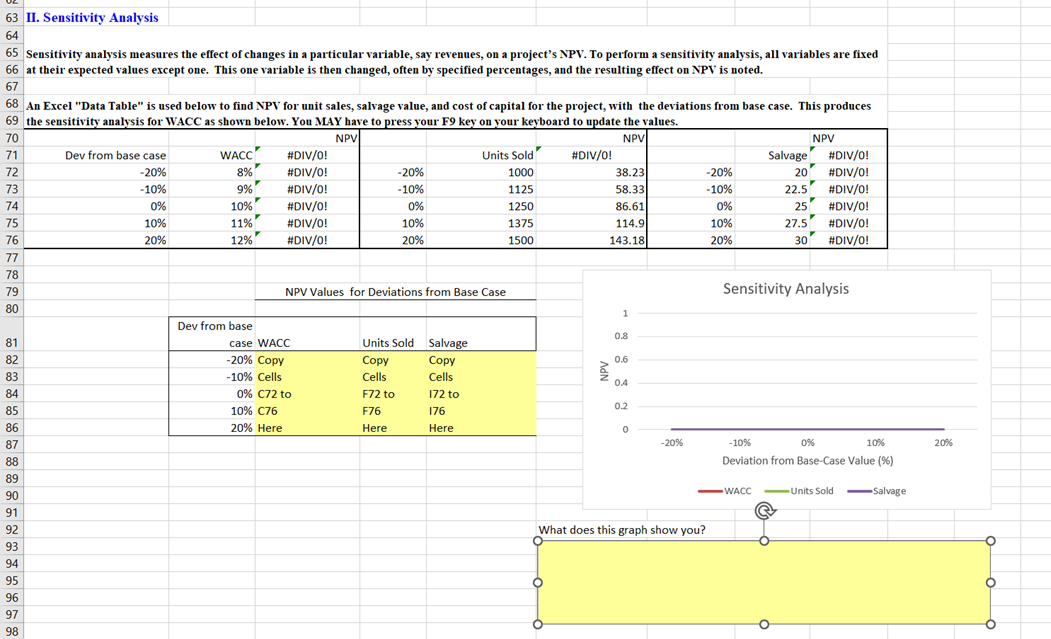
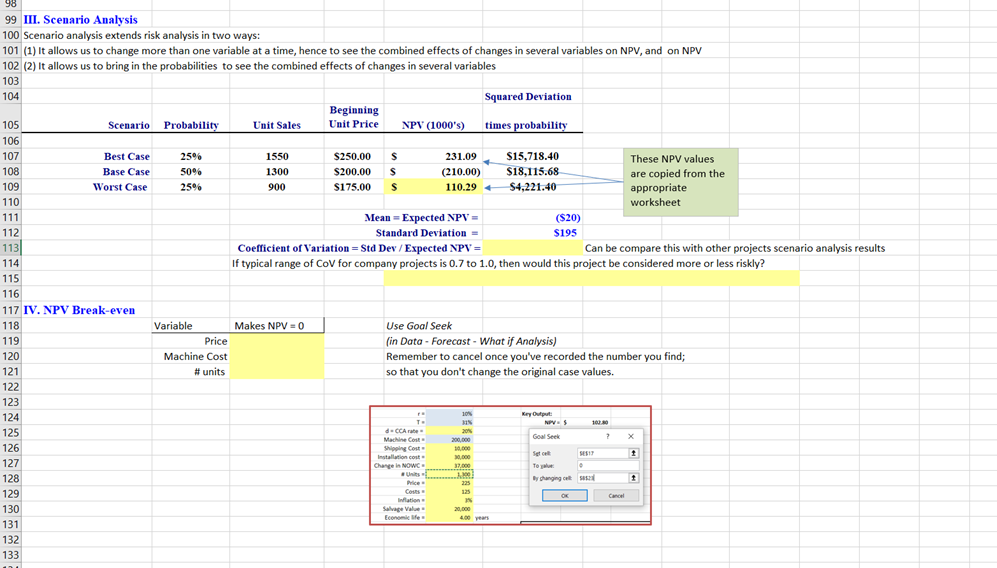
Shrek Casting Company is considering adding a new line to its product mix. The production line would be set up in unused space in Shrek's main plant. The machinery's invoice price would be approximately $210,000; another $15,000 in shipping charges would be required; and it would cost an additional $30,000 to install the equipment. The machinery has an economic life of 4 years, and would be a class 8 with a 20%CCA rate. The machinery is expected to have a salvage value of $15,000 after 4 years of use. The new line would generate incremental sales of 1,300 units per year for four years at an incremental cost of $125 per unit in the first year, excluding depreciation. Each unit can be sold for $225 in the first year. The sales price and cost are expected to increase by 3% per year due to inflation. Further, to handle the new line, the firm's net operating working capital would have to increase by an amount of $35,000. The firm's tax rate is 29%, and its overall weighted average cost of capital is 11 Sensitivity analysis measures the effect of changes in a particular variable, say revenues, on a project's NPV. To perform a sensitivity analysis, all variables are fixed at their expected values except one. This one variable is then changed, often by specified percentages, and the resulting effect on NPV is noted. III. Scenario Analysis Scenario analysis extends risk analysis in two ways: (1) It allows us to change more than one variable at a time, hence to see the combined effects of changes in several variables on NPV, and on NPV (2) It allows us to bring in the probabilities to see the combined effects of changes in several variables 103 104 105 \begin{tabular}{|c|c|c|c|c|c|c|c|} \hline & & & & & & Squared Deviation & \\ \hline Scenario & Probability & Unit Sales & \begin{tabular}{l} Beginning \\ Unit Price \\ \end{tabular} & & .000 's) & times probability & \\ \hline Best Case & 25% & 1550 & $250.00 & $ & 231.09 & $15,718.40 & \multirow{5}{*}{\begin{tabular}{l} These NPV values \\ are copied from the \\ appropriate \\ worksheet \end{tabular}} \\ \hline Base Case & 50% & 1300 & $200.00 & s & (210.00) & $18,115.68 & \\ \hline Worst Case & 25% & 900 & $175.00 & s & 110.29 & \( \varangle \quad \$ 4,221,40 \) & \\ \hline & & & & & & & \\ \hline & & & \multicolumn{3}{|c|}{ Mean = Expected NPV =} & (\$20) & \\ \hline \end{tabular} StandardDeviation=CoefficientofVariation=StdDev/ExpectedNPV=$195 Coeficient of Variation = Std Dev / Expected NPV = Can be compare this with other projects scenario analysis results If typical range of CoV for company projects is 0.7 to 1.0 , then would this project be considered more or less riskly? IV. NPV Break-even
Step by Step Solution
There are 3 Steps involved in it

Get step-by-step solutions from verified subject matter experts