

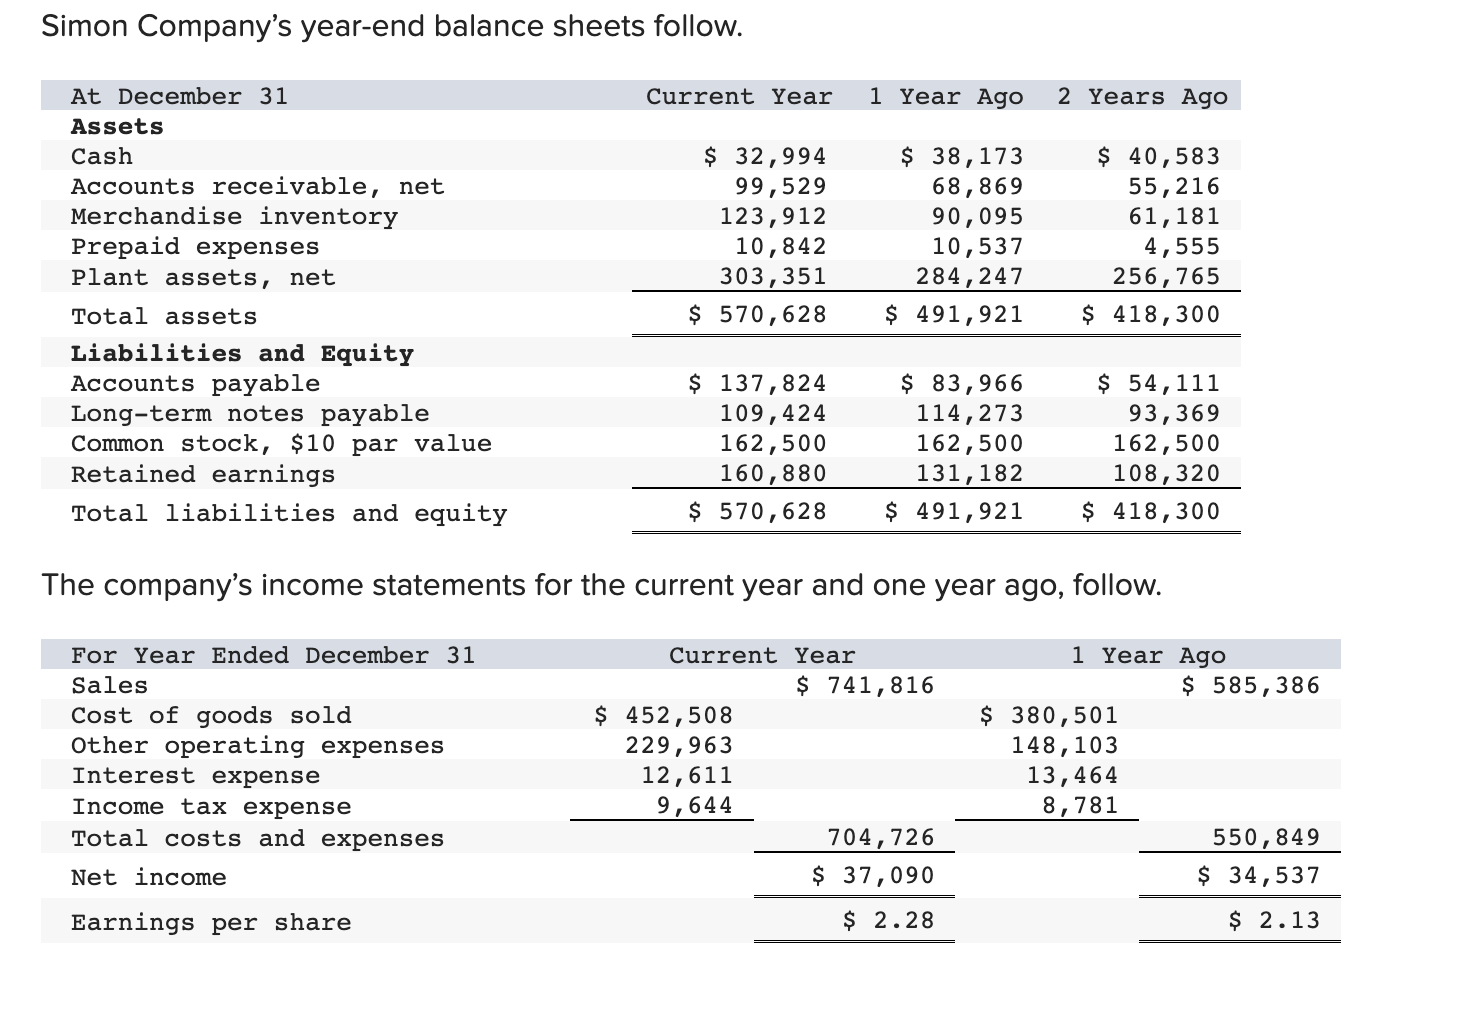
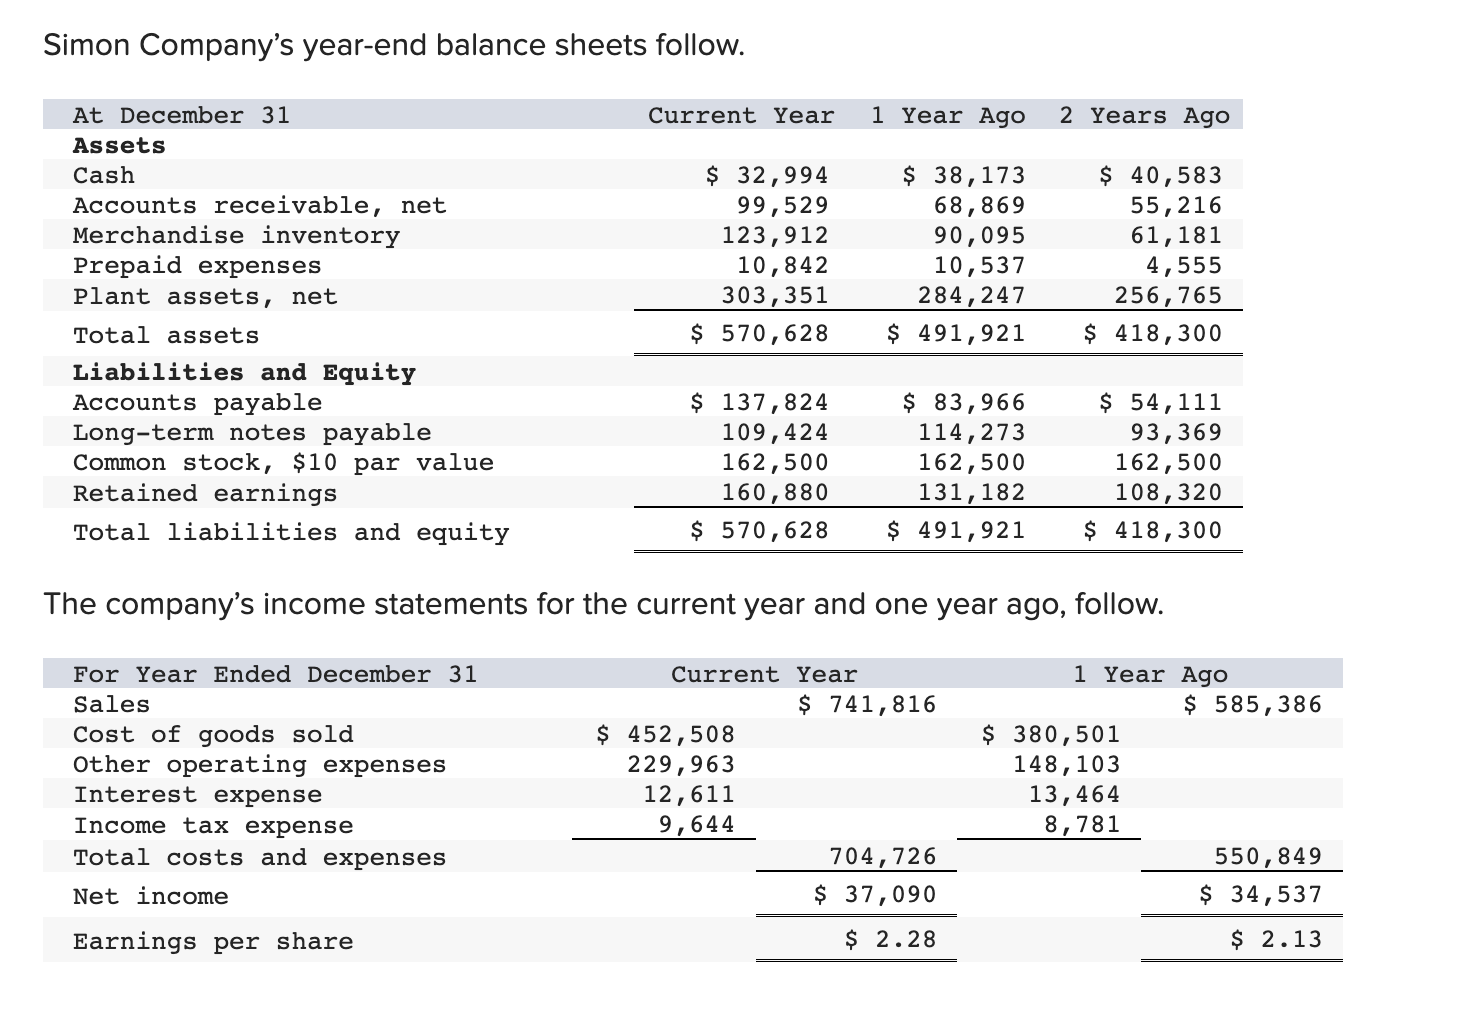
Simon Company's year-end balance sheets follow. At December 31 Assets Cash Accounts receivable, net Merchandise inventory...
Fantastic news! We've Found the answer you've been seeking!
Question:
Transcribed Image Text:
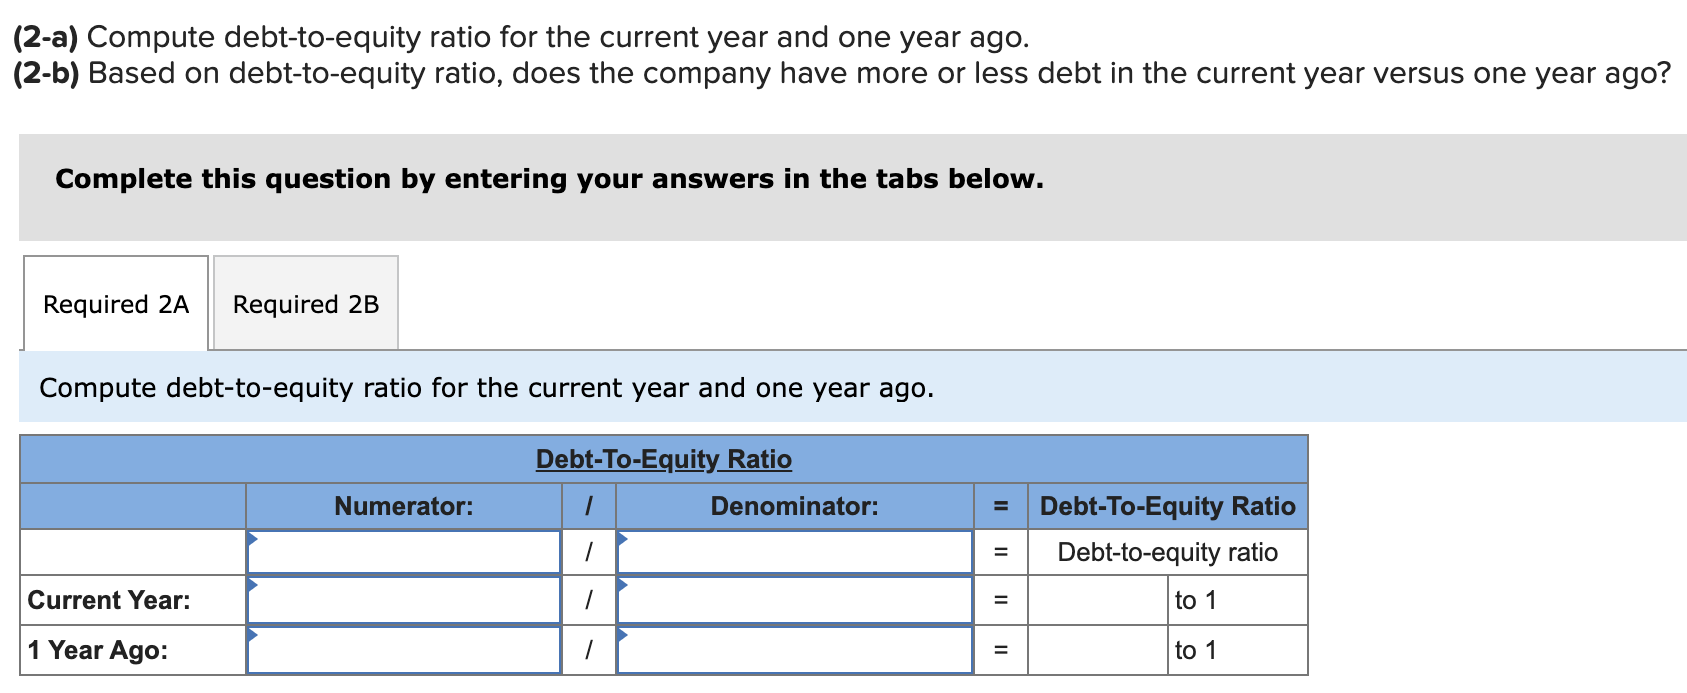
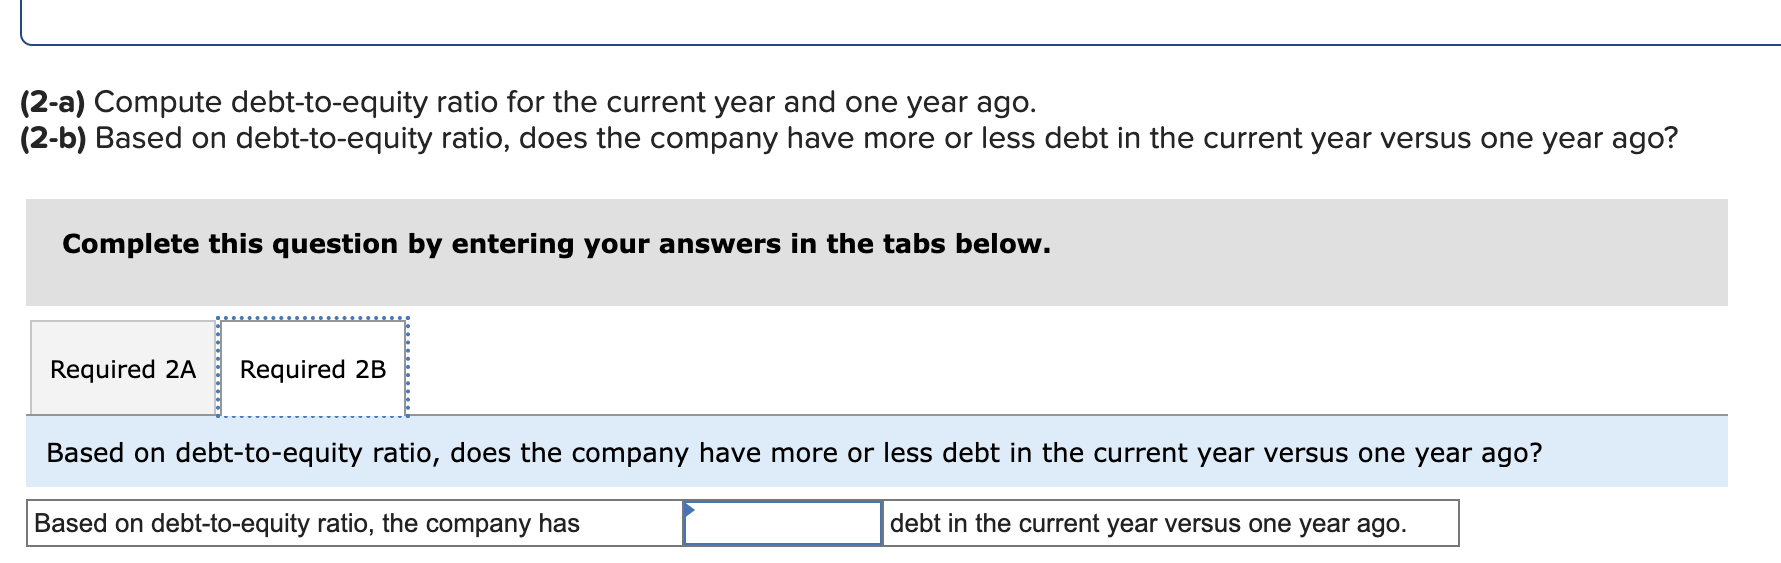
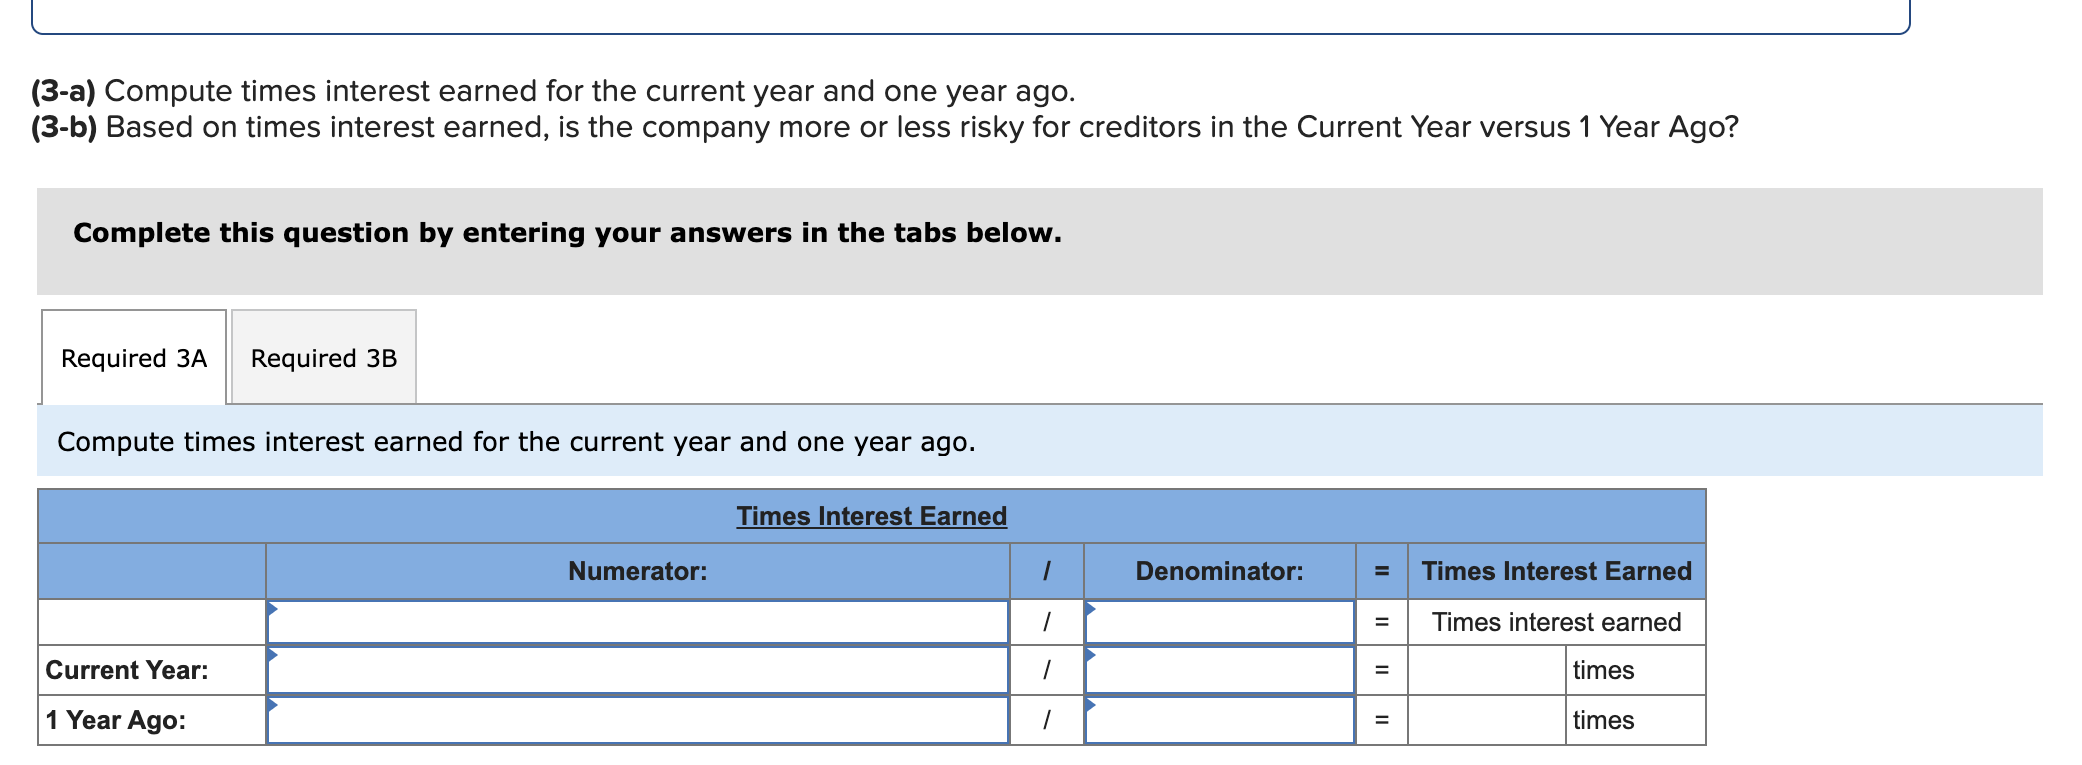
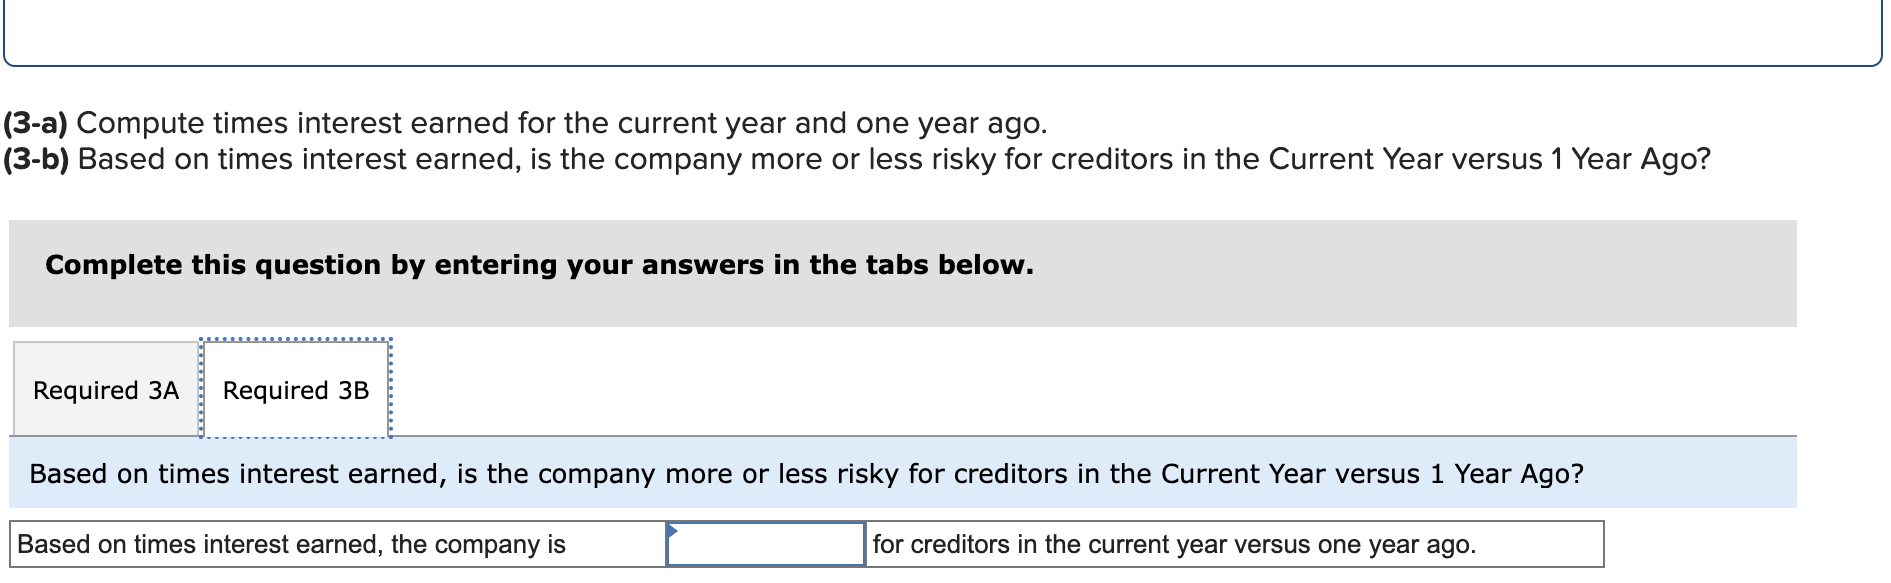
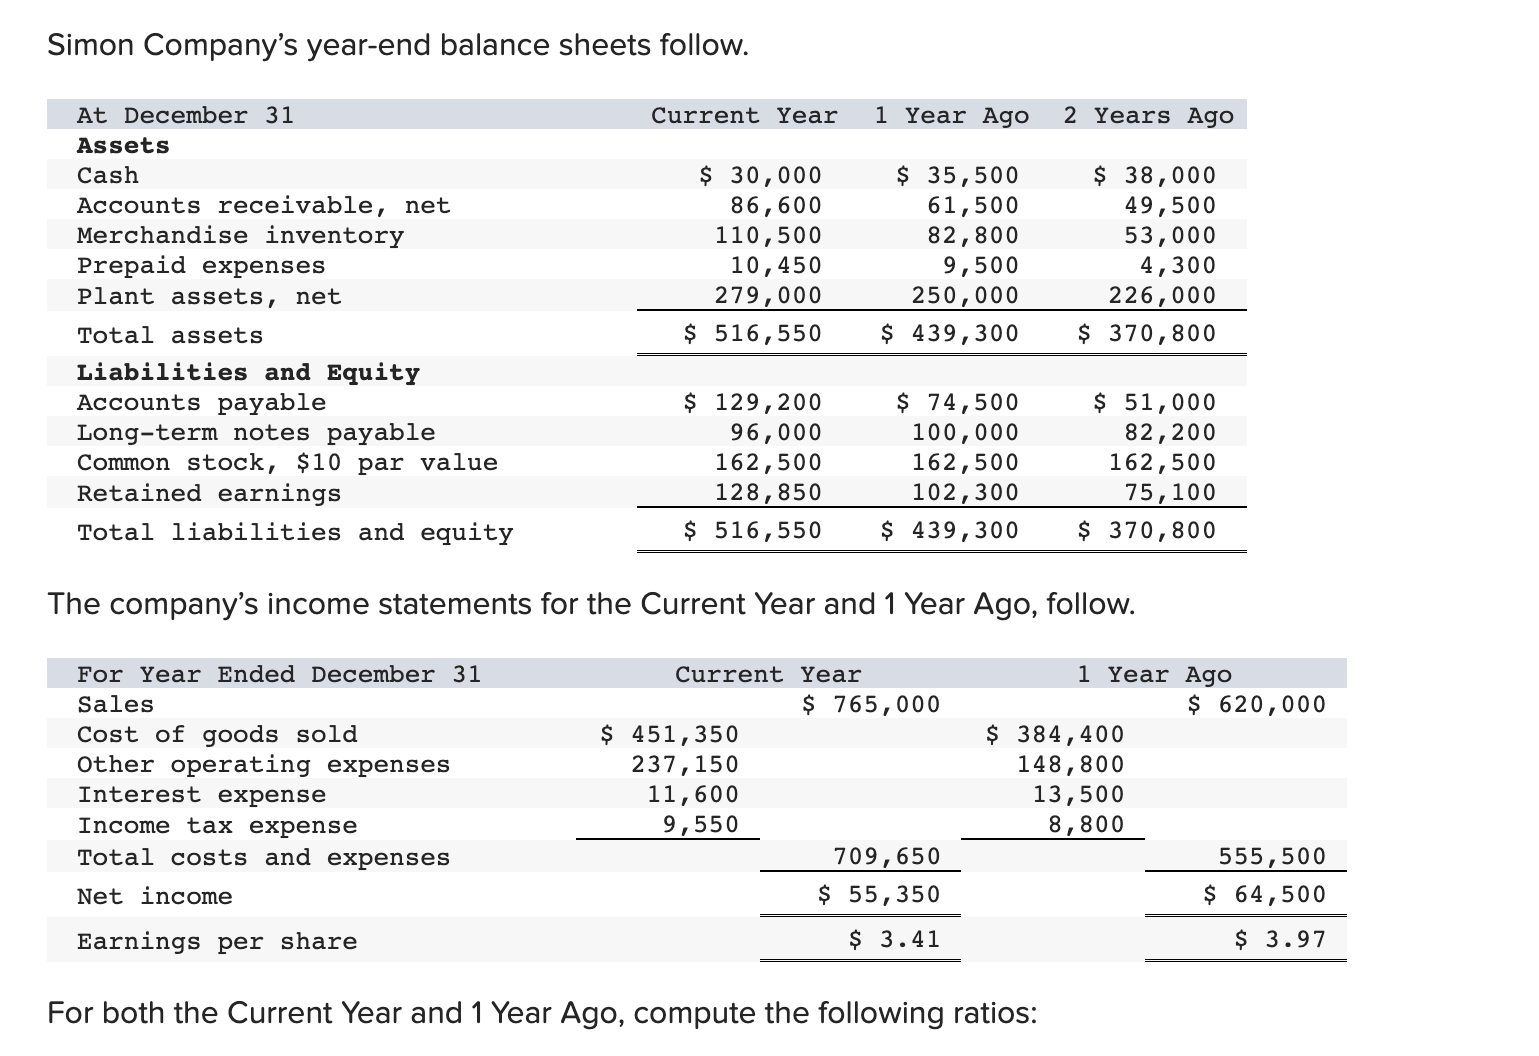
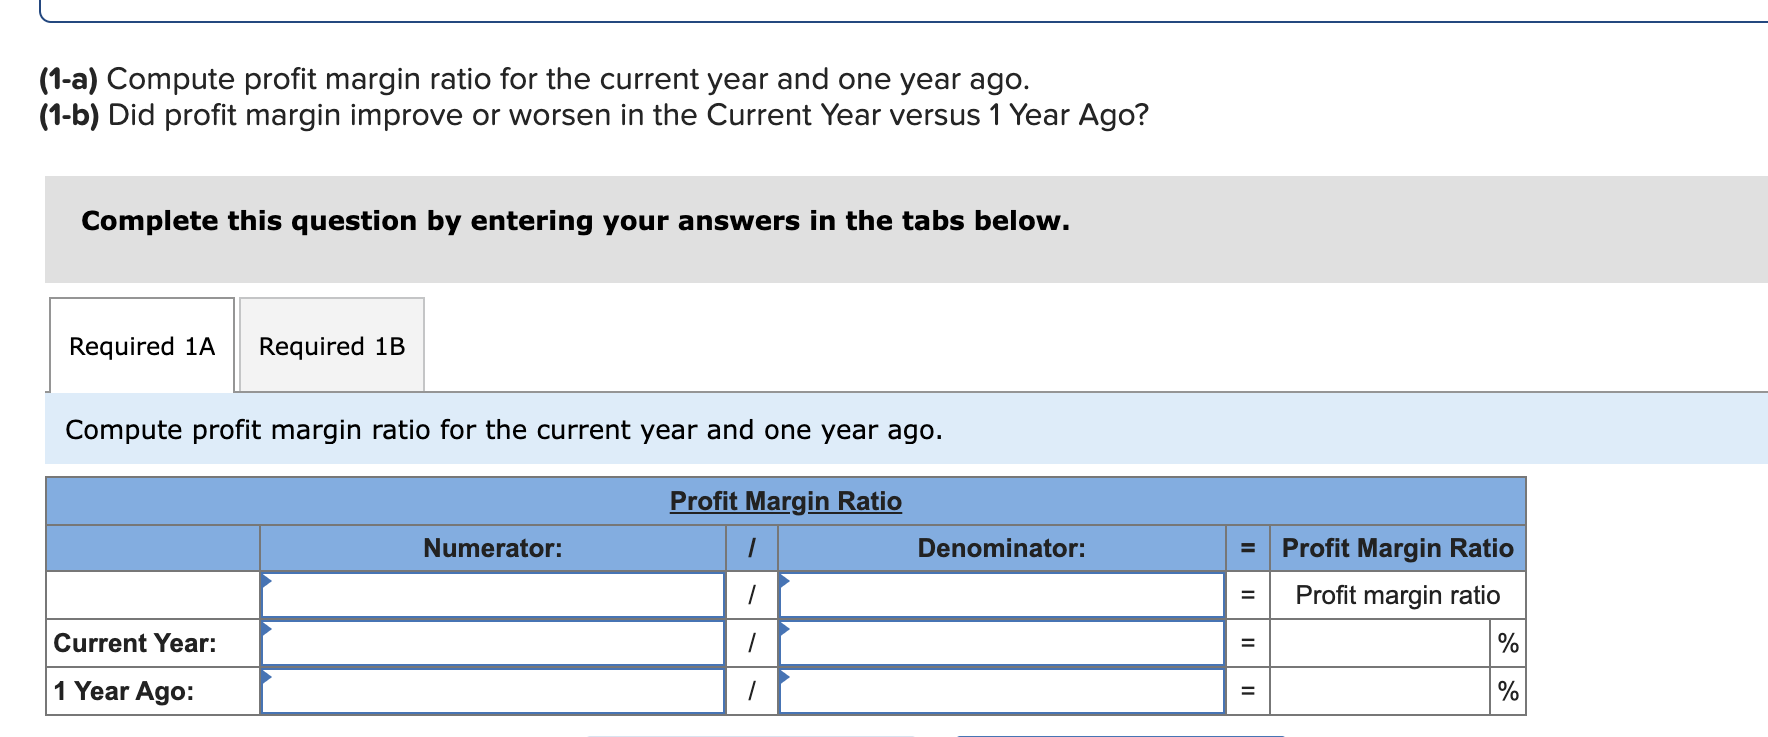
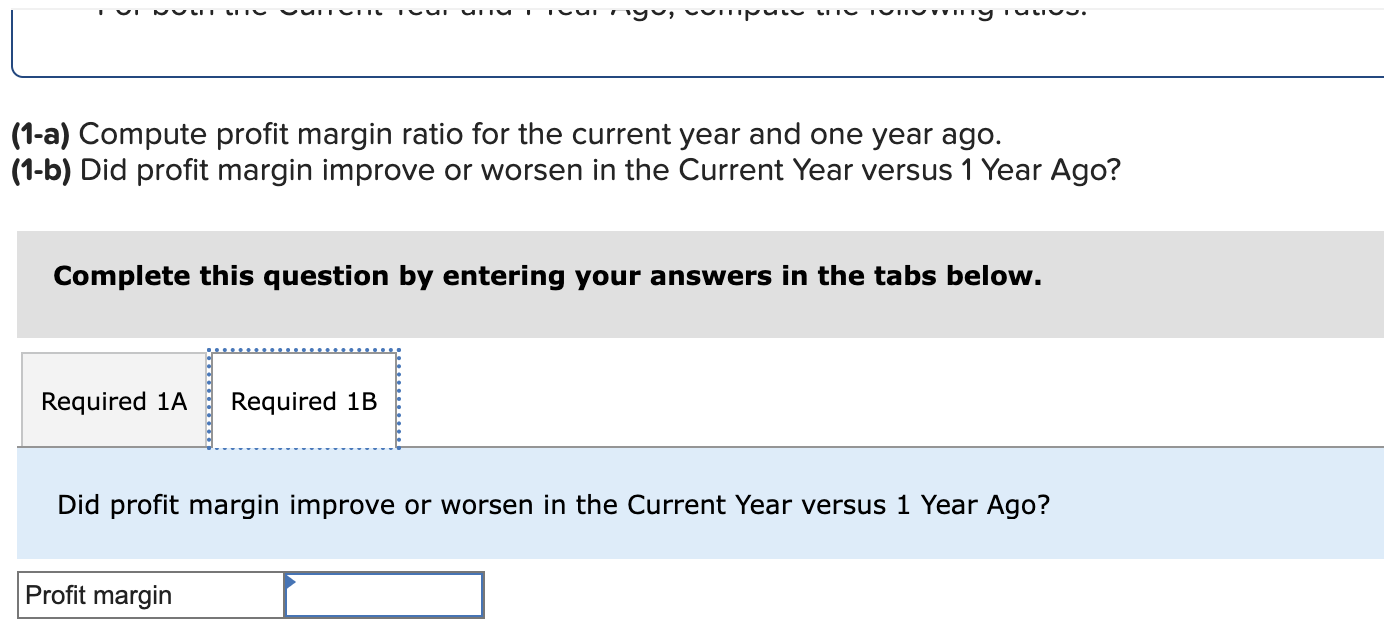
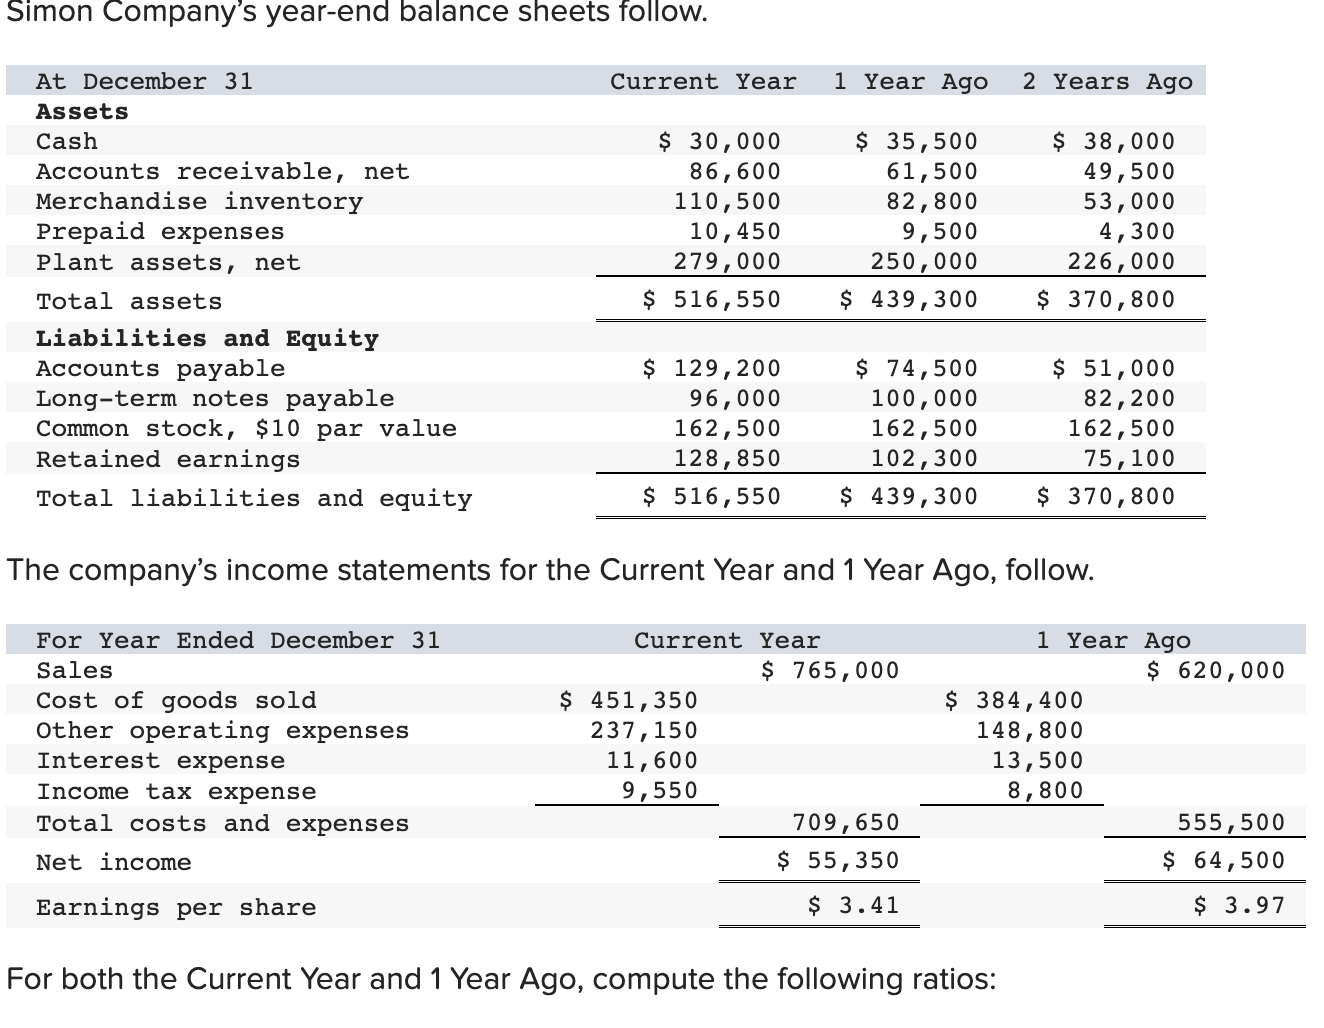
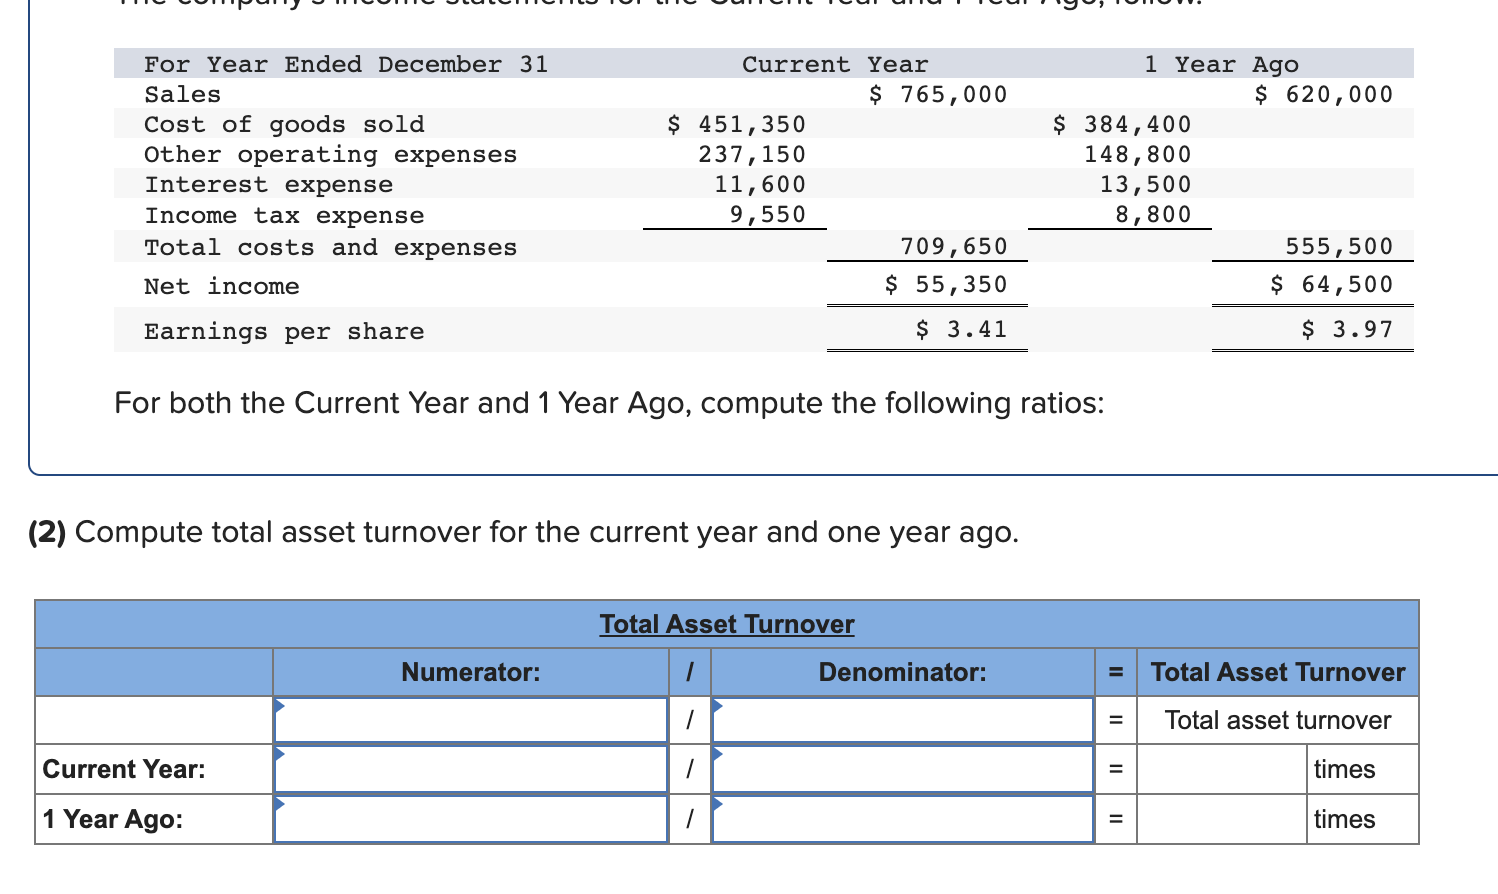
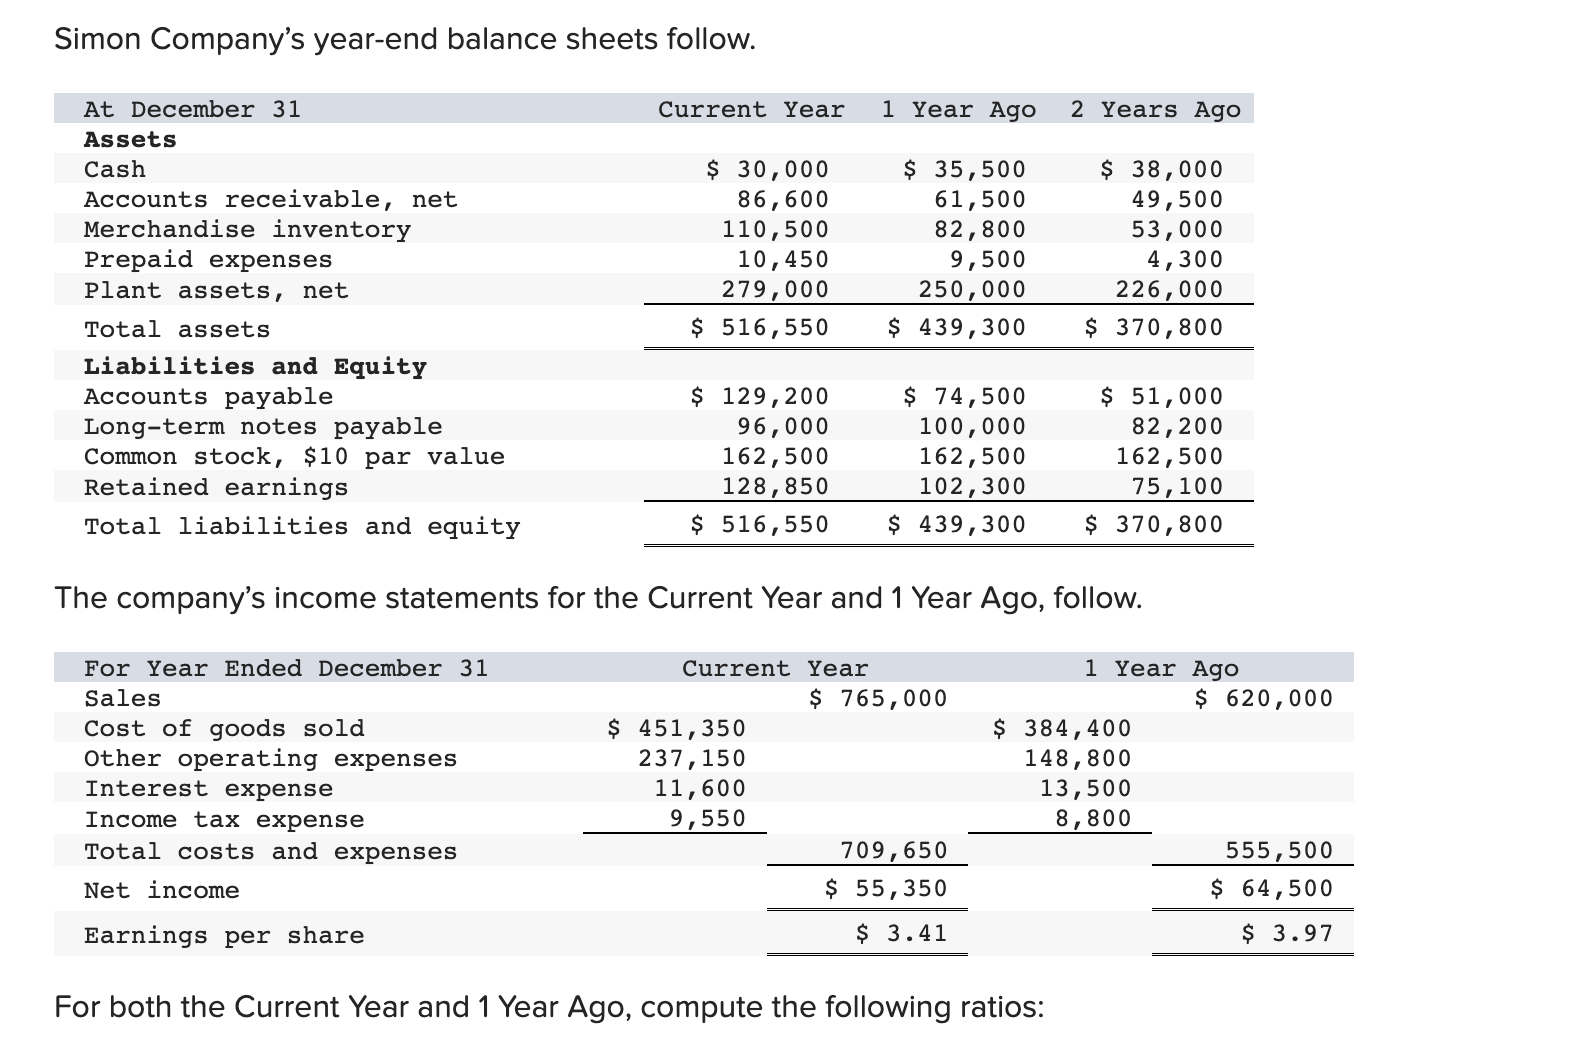
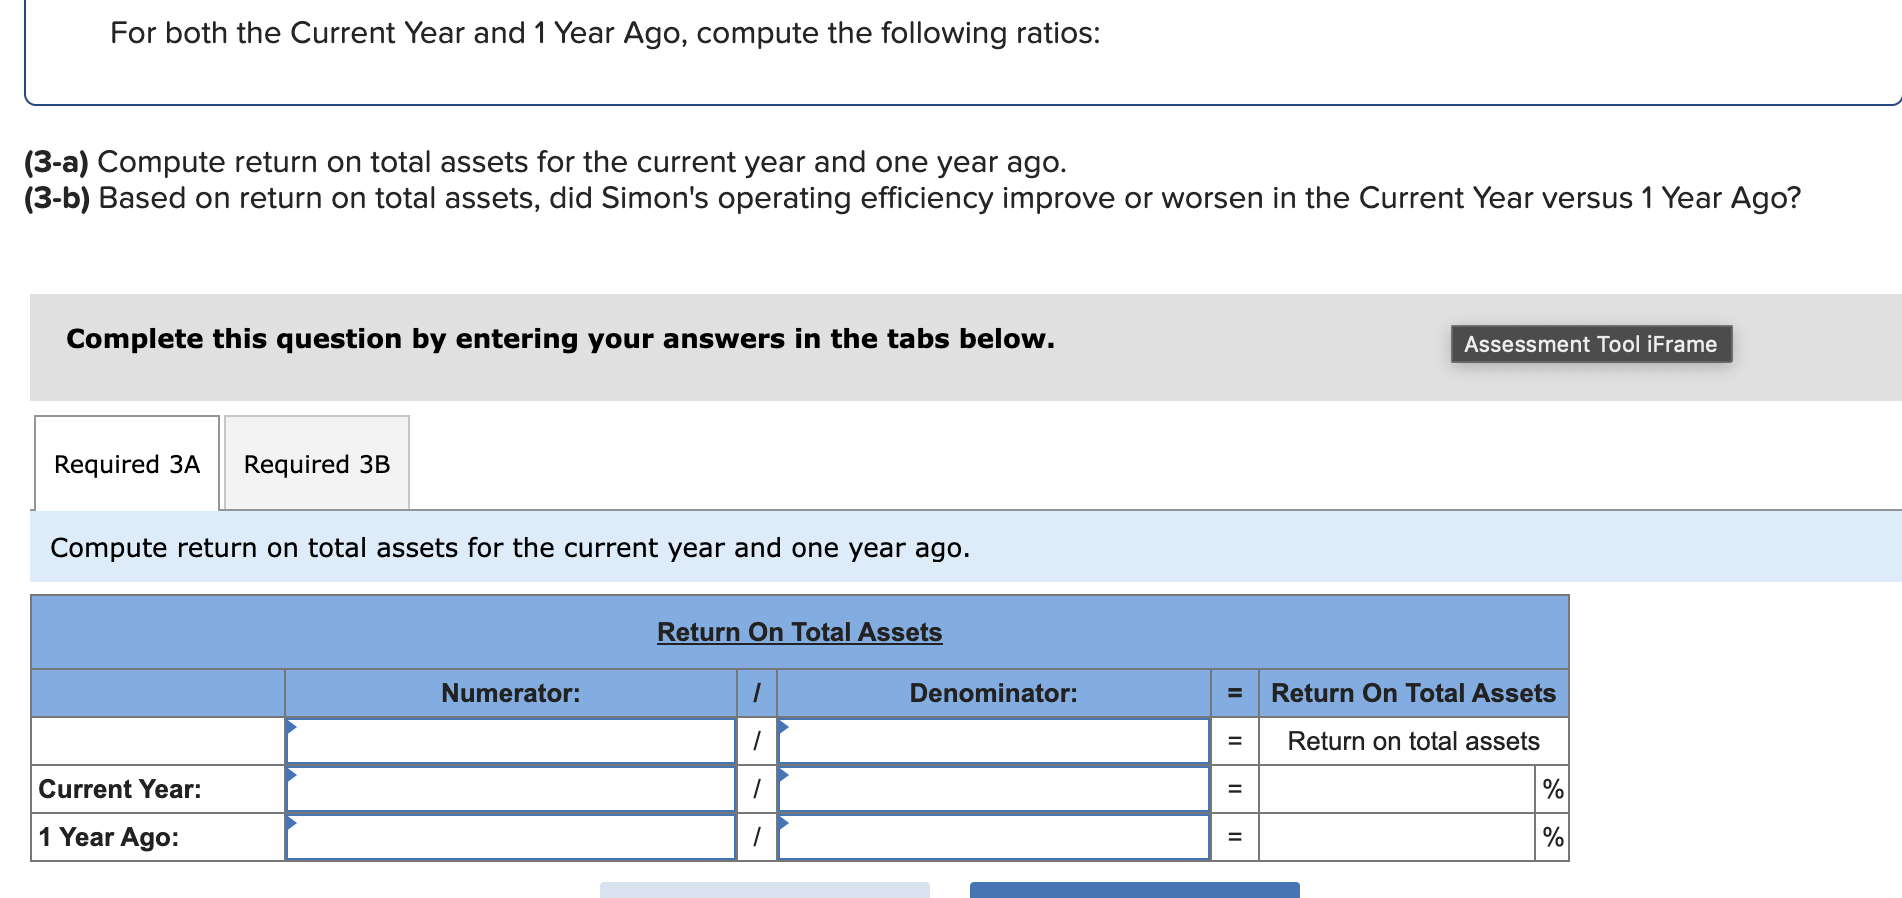
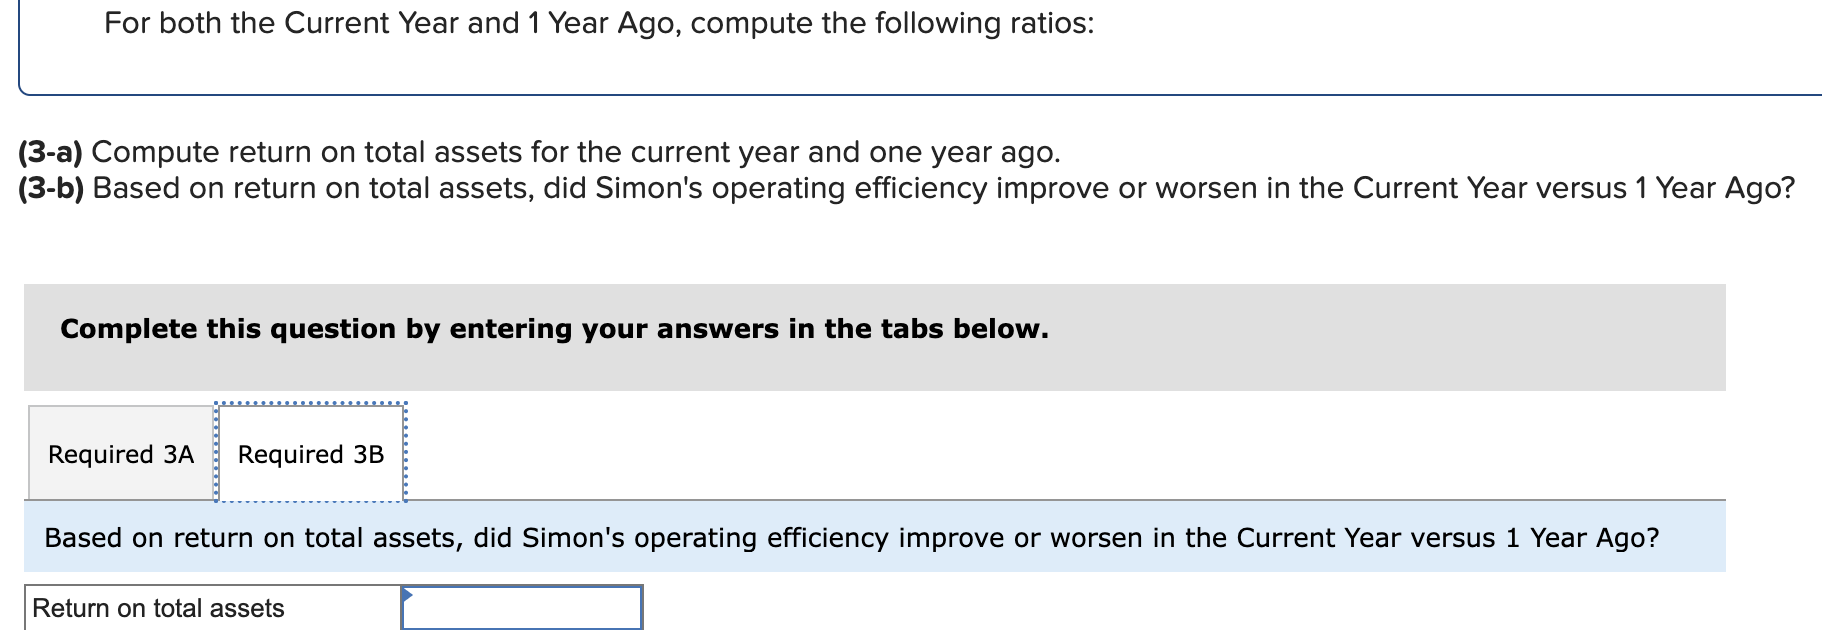
Simon Company's year-end balance sheets follow. At December 31 Assets Cash Accounts receivable, net Merchandise inventory Prepaid expenses Plant assets, net Total assets Liabilities and Equity Accounts payable Current Year 1 Year Ago 2 Years Ago $ 32,994 99,529 123,912 10,842 303,351 $ 570,628 $ 38,173 68,869 90,095 10,537 284,247 $ 491,921 $ 83,966 114,273 162,500 131,182 Long-term notes payable Common stock, $10 par value Retained earnings $ 137,824 109,424 162,500 160,880 Total liabilities and equity $ 570,628 $ 491,921 $ 40,583 55,216 61,181 4,555 256,765 $ 418,300 $ 54,111 93,369 162,500 108,320 $ 418,300 The company's income statements for the current year and one year ago, follow. For Year Ended December 31 Sales Cost of goods sold Other operating expenses Interest expense Income tax expense Total costs and expenses Net income Earnings per share Current Year $ 452,508 229,963 12,611 $ 741,816 9,644 704,726 $ 37,090 $ 2.28 1 Year Ago $ 585,386 $ 380,501 148,103 13,464 8,781 550,849 $ 34,537 $ 2.13 (2-a) Compute debt-to-equity ratio for the current year and one year ago. (2-b) Based on debt-to-equity ratio, does the company have more or less debt in the current year versus one year ago? Complete this question by entering your answers in the tabs below. Required 2A Required 2B Compute debt-to-equity ratio for the current year and one year ago. Current Year: 1 Year Ago: Numerator: Debt-To-Equity Ratio Denominator: = Debt-To-Equity Ratio || = Debt-to-equity ratio = to 1 = to 1 (2-a) Compute debt-to-equity ratio for the current year and one year ago. (2-b) Based on debt-to-equity ratio, does the company have more or less debt in the current year versus one year ago? Complete this question by entering your answers in the tabs below. Required 2A Required 2B Based on debt-to-equity ratio, does the company have more or less debt in the current year versus one year ago? Based on debt-to-equity ratio, the company has debt in the current year versus one year ago. Simon Company's year-end balance sheets follow. At December 31 Assets Cash Accounts receivable, net Merchandise inventory Prepaid expenses Plant assets, net Total assets Liabilities and Equity Accounts payable Current Year 1 Year Ago 2 Years Ago $ 32,994 99,529 123,912 10,842 303,351 $ 570,628 $ 137,824 Long-term notes payable Common stock, $10 par value Retained earnings Total liabilities and equity 109,424 162,500 160,880 $ 570,628 $ 38,173 68,869 90,095 10,537 284,247 $ 491,921 $ 83,966 114,273 162,500 131,182 $ 491,921 $ 40,583 55,216 61,181 4,555 256,765 $ 418,300 $ 54,111 93,369 162,500 108,320 $ 418,300 The company's income statements for the current year and one year ago, follow. For Year Ended December 31 Sales Cost of goods sold Other operating expenses Interest expense Income tax expense Total costs and expenses Net income Earnings per share Current Year $ 741,816 $ 452,508 229,963 12,611 9,644 1 Year Ago $ 585,386 704,726 $ 37,090 $ 380,501 148,103 13,464 8,781 550,849 $ 34,537 $ 2.13 $ 2.28 (3-a) Compute times interest earned for the current year and one year ago. (3-b) Based on times interest earned, is the company more or less risky for creditors in the Current Year versus 1 Year Ago? Complete this question by entering your answers in the tabs below. Required 3A Required 3B Compute times interest earned for the current year and one year ago. Current Year: 1 Year Ago: Times Interest Earned Numerator: Denominator: = Times Interest Earned = Times interest earned = times = times (3-a) Compute times interest earned for the current year and one year ago. (3-b) Based on times interest earned, is the company more or less risky for creditors in the Current Year versus 1 Year Ago? Complete this question by entering your answers in the tabs below. Required 3A Required 3B Based on times interest earned, is the company more or less risky for creditors in the Current Year versus 1 Year Ago? Based on times interest earned, the company is for creditors in the current year versus one year ago. Simon Company's year-end balance sheets follow. At December 31 Assets Cash Accounts receivable, net Merchandise inventory Prepaid expenses Plant assets, net Total assets Liabilities and Equity Accounts payable Current Year 1 Year Ago 2 Years Ago $ 30,000 86,600 110,500 10,450 279,000 $ 516,550 $ 129,200 $ 35,500 61,500 82,800 9,500 250,000 $ 439,300 $ 38,000 49,500 53,000 4,300 226,000 $ 370,800 Long-term notes payable Common stock, $10 par value Retained earnings Total liabilities and equity 96,000 162,500 128,850 $ 74,500 100,000 $ 51,000 162,500 102,300 $ 516,550 $ 439,300 82,200 162,500 75,100 $ 370,800 The company's income statements for the Current Year and 1 Year Ago, follow. For Year Ended December 31 Sales Cost of goods sold Interest expense Other operating expenses Income tax expense Current Year $ 765,000 $ 451,350 237,150 11,600 9,550 1 Year Ago $ 620,000 709,650 $ 55,350 $ 3.41 $ 384,400 148,800 13,500 8,800 555,500 $ 64,500 $ 3.97 Total costs and expenses Net income Earnings per share For both the Current Year and 1 Year Ago, compute the following ratios: (1-a) Compute profit margin ratio for the current year and one year ago. (1-b) Did profit margin improve or worsen in the Current Year versus 1 Year Ago? Complete this question by entering your answers in the tabs below. Required 1A Required 1B Compute profit margin ratio for the current year and one year ago. Current Year: 1 Year Ago: Numerator: Profit Margin Ratio Denominator: Profit Margin Ratio = Profit margin ratio = % = % " (1-a) Compute profit margin ratio for the current year and one year ago. (1-b) Did profit margin improve or worsen in the Current Year versus 1 Year Ago? Complete this question by entering your answers in the tabs below. Required 1A Required 1B Did profit margin improve or worsen in the Current Year versus 1 Year Ago? Profit margin Simon Company's year-end balance sheets follow. At December 31 Assets Cash Accounts receivable, net Merchandise inventory Prepaid expenses Plant assets, net Total assets Liabilities and Equity Accounts payable Current Year 1 Year Ago 2 Years Ago $ 30,000 86,600 110,500 10,450 279,000 $ 35,500 61,500 $ 38,000 82,800 9,500 250,000 49,500 53,000 4,300 226,000 $ 370,800 $ 516,550 $ 439,300 $ 129,200 $ 74,500 100,000 162,500 102,300 $ 51,000 Long-term notes payable Common stock, $10 par value Retained earnings Total liabilities and equity 96,000 162,500 128,850 $ 516,550 $ 439,300 82,200 162,500 75,100 $ 370,800 The company's income statements for the Current Year and 1 Year Ago, follow. For Year Ended December 31 Sales Cost of goods sold Interest expense Other operating expenses Income tax expense Current Year $ 765,000 $ 451,350 237,150 11,600 9,550 1 Year Ago $ 620,000 709,650 $ 55,350 $ 3.41 $ 384,400 148,800 13,500 8,800 555,500 $ 64,500 $ 3.97 Total costs and expenses Net income Earnings per share For both the Current Year and 1 Year Ago, compute the following ratios: For Year Ended December 31 Sales Cost of goods sold Other operating expenses Interest expense Current Year $ 451,350 237,150 11,600 1 Year Ago $ 620,000 $ 765,000 $ 384,400 148,800 13,500 Income tax expense Total costs and expenses Net income Earnings per share. 9,550 8,800 709,650 $ 55,350 $ 3.41 For both the Current Year and 1 Year Ago, compute the following ratios: (2) Compute total asset turnover for the current year and one year ago. Current Year: 1 Year Ago: Total Asset Turnover Numerator: Denominator: 555,500 $ 64,500 $ 3.97 Total Asset Turnover = Total asset turnover = times = times Simon Company's year-end balance sheets follow. At December 31 Assets Cash Accounts receivable, net Merchandise inventory Prepaid expenses Plant assets, net Total assets Liabilities and Equity Accounts payable Current Year 1 Year Ago 2 Years Ago $ 30,000 86,600 110,500 10,450 279,000 $ 35,500 61,500 82,800 9,500 250,000 $ 516,550 $ 439,300 $ 129,200 Long-term notes payable 96,000 Common stock, $10 par value Retained earnings $ 74,500 100,000 162,500 102,300 Total liabilities and equity 162,500 128,850 $ 516,550 $ 439,300 $ 38,000 49,500 53,000 4,300 226,000 $ 370,800 $ 51,000 82,200 162,500 75,100 $ 370,800 The company's income statements for the Current Year and 1 Year Ago, follow. For Year Ended December 31 Sales Cost of goods sold Other operating expenses Income tax expense Interest expense Current Year 1 Year Ago $ 765,000 $ 620,000 $ 451,350 237,150 $ 384,400 148,800 13,500 8,800 11,600 9,550 709,650 $ 55,350 Total costs and expenses Net income Earnings per share $ 3.41 For both the Current Year and 1 Year Ago, compute the following ratios: 555,500 $ 64,500 $ 3.97 For both the Current Year and 1 Year Ago, compute the following ratios: (3-a) Compute return on total assets for the current year and one year ago. (3-b) Based on return on total assets, did Simon's operating efficiency improve or worsen in the Current Year versus 1 Year Ago? Complete this question by entering your answers in the tabs below. Required 3A Required 3B Compute return on total assets for the current year and one year ago. Current Year: 1 Year Ago: Assessment Tool iFrame Return On Total Assets Numerator: Denominator: = Return On Total Assets 1 = Return on total assets 1 = || % = % For both the Current Year and 1 Year Ago, compute the following ratios: (3-a) Compute return on total assets for the current year and one year ago. (3-b) Based on return on total assets, did Simon's operating efficiency improve or worsen in the Current Year versus 1 Year Ago? Complete this question by entering your answers in the tabs below. Required 3A Required 3B Based on return on total assets, did Simon's operating efficiency improve or worsen in the Current Year versus 1 Year Ago? Return on total assets Simon Company's year-end balance sheets follow. At December 31 Assets Cash Accounts receivable, net Merchandise inventory Prepaid expenses Plant assets, net Total assets Liabilities and Equity Accounts payable Current Year 1 Year Ago 2 Years Ago $ 32,994 99,529 123,912 10,842 303,351 $ 570,628 $ 38,173 68,869 90,095 10,537 284,247 $ 491,921 $ 83,966 114,273 162,500 131,182 Long-term notes payable Common stock, $10 par value Retained earnings $ 137,824 109,424 162,500 160,880 Total liabilities and equity $ 570,628 $ 491,921 $ 40,583 55,216 61,181 4,555 256,765 $ 418,300 $ 54,111 93,369 162,500 108,320 $ 418,300 The company's income statements for the current year and one year ago, follow. For Year Ended December 31 Sales Cost of goods sold Other operating expenses Interest expense Income tax expense Total costs and expenses Net income Earnings per share Current Year $ 452,508 229,963 12,611 $ 741,816 9,644 704,726 $ 37,090 $ 2.28 1 Year Ago $ 585,386 $ 380,501 148,103 13,464 8,781 550,849 $ 34,537 $ 2.13 (2-a) Compute debt-to-equity ratio for the current year and one year ago. (2-b) Based on debt-to-equity ratio, does the company have more or less debt in the current year versus one year ago? Complete this question by entering your answers in the tabs below. Required 2A Required 2B Compute debt-to-equity ratio for the current year and one year ago. Current Year: 1 Year Ago: Numerator: Debt-To-Equity Ratio Denominator: = Debt-To-Equity Ratio || = Debt-to-equity ratio = to 1 = to 1 (2-a) Compute debt-to-equity ratio for the current year and one year ago. (2-b) Based on debt-to-equity ratio, does the company have more or less debt in the current year versus one year ago? Complete this question by entering your answers in the tabs below. Required 2A Required 2B Based on debt-to-equity ratio, does the company have more or less debt in the current year versus one year ago? Based on debt-to-equity ratio, the company has debt in the current year versus one year ago. Simon Company's year-end balance sheets follow. At December 31 Assets Cash Accounts receivable, net Merchandise inventory Prepaid expenses Plant assets, net Total assets Liabilities and Equity Accounts payable Current Year 1 Year Ago 2 Years Ago $ 32,994 99,529 123,912 10,842 303,351 $ 570,628 $ 137,824 Long-term notes payable Common stock, $10 par value Retained earnings Total liabilities and equity 109,424 162,500 160,880 $ 570,628 $ 38,173 68,869 90,095 10,537 284,247 $ 491,921 $ 83,966 114,273 162,500 131,182 $ 491,921 $ 40,583 55,216 61,181 4,555 256,765 $ 418,300 $ 54,111 93,369 162,500 108,320 $ 418,300 The company's income statements for the current year and one year ago, follow. For Year Ended December 31 Sales Cost of goods sold Other operating expenses Interest expense Income tax expense Total costs and expenses Net income Earnings per share Current Year $ 741,816 $ 452,508 229,963 12,611 9,644 1 Year Ago $ 585,386 704,726 $ 37,090 $ 380,501 148,103 13,464 8,781 550,849 $ 34,537 $ 2.13 $ 2.28 (3-a) Compute times interest earned for the current year and one year ago. (3-b) Based on times interest earned, is the company more or less risky for creditors in the Current Year versus 1 Year Ago? Complete this question by entering your answers in the tabs below. Required 3A Required 3B Compute times interest earned for the current year and one year ago. Current Year: 1 Year Ago: Times Interest Earned Numerator: Denominator: = Times Interest Earned = Times interest earned = times = times (3-a) Compute times interest earned for the current year and one year ago. (3-b) Based on times interest earned, is the company more or less risky for creditors in the Current Year versus 1 Year Ago? Complete this question by entering your answers in the tabs below. Required 3A Required 3B Based on times interest earned, is the company more or less risky for creditors in the Current Year versus 1 Year Ago? Based on times interest earned, the company is for creditors in the current year versus one year ago. Simon Company's year-end balance sheets follow. At December 31 Assets Cash Accounts receivable, net Merchandise inventory Prepaid expenses Plant assets, net Total assets Liabilities and Equity Accounts payable Current Year 1 Year Ago 2 Years Ago $ 30,000 86,600 110,500 10,450 279,000 $ 516,550 $ 129,200 $ 35,500 61,500 82,800 9,500 250,000 $ 439,300 $ 38,000 49,500 53,000 4,300 226,000 $ 370,800 Long-term notes payable Common stock, $10 par value Retained earnings Total liabilities and equity 96,000 162,500 128,850 $ 74,500 100,000 $ 51,000 162,500 102,300 $ 516,550 $ 439,300 82,200 162,500 75,100 $ 370,800 The company's income statements for the Current Year and 1 Year Ago, follow. For Year Ended December 31 Sales Cost of goods sold Interest expense Other operating expenses Income tax expense Current Year $ 765,000 $ 451,350 237,150 11,600 9,550 1 Year Ago $ 620,000 709,650 $ 55,350 $ 3.41 $ 384,400 148,800 13,500 8,800 555,500 $ 64,500 $ 3.97 Total costs and expenses Net income Earnings per share For both the Current Year and 1 Year Ago, compute the following ratios: (1-a) Compute profit margin ratio for the current year and one year ago. (1-b) Did profit margin improve or worsen in the Current Year versus 1 Year Ago? Complete this question by entering your answers in the tabs below. Required 1A Required 1B Compute profit margin ratio for the current year and one year ago. Current Year: 1 Year Ago: Numerator: Profit Margin Ratio Denominator: Profit Margin Ratio = Profit margin ratio = % = % " (1-a) Compute profit margin ratio for the current year and one year ago. (1-b) Did profit margin improve or worsen in the Current Year versus 1 Year Ago? Complete this question by entering your answers in the tabs below. Required 1A Required 1B Did profit margin improve or worsen in the Current Year versus 1 Year Ago? Profit margin Simon Company's year-end balance sheets follow. At December 31 Assets Cash Accounts receivable, net Merchandise inventory Prepaid expenses Plant assets, net Total assets Liabilities and Equity Accounts payable Current Year 1 Year Ago 2 Years Ago $ 30,000 86,600 110,500 10,450 279,000 $ 35,500 61,500 $ 38,000 82,800 9,500 250,000 49,500 53,000 4,300 226,000 $ 370,800 $ 516,550 $ 439,300 $ 129,200 $ 74,500 100,000 162,500 102,300 $ 51,000 Long-term notes payable Common stock, $10 par value Retained earnings Total liabilities and equity 96,000 162,500 128,850 $ 516,550 $ 439,300 82,200 162,500 75,100 $ 370,800 The company's income statements for the Current Year and 1 Year Ago, follow. For Year Ended December 31 Sales Cost of goods sold Interest expense Other operating expenses Income tax expense Current Year $ 765,000 $ 451,350 237,150 11,600 9,550 1 Year Ago $ 620,000 709,650 $ 55,350 $ 3.41 $ 384,400 148,800 13,500 8,800 555,500 $ 64,500 $ 3.97 Total costs and expenses Net income Earnings per share For both the Current Year and 1 Year Ago, compute the following ratios: For Year Ended December 31 Sales Cost of goods sold Other operating expenses Interest expense Current Year $ 451,350 237,150 11,600 1 Year Ago $ 620,000 $ 765,000 $ 384,400 148,800 13,500 Income tax expense Total costs and expenses Net income Earnings per share. 9,550 8,800 709,650 $ 55,350 $ 3.41 For both the Current Year and 1 Year Ago, compute the following ratios: (2) Compute total asset turnover for the current year and one year ago. Current Year: 1 Year Ago: Total Asset Turnover Numerator: Denominator: 555,500 $ 64,500 $ 3.97 Total Asset Turnover = Total asset turnover = times = times Simon Company's year-end balance sheets follow. At December 31 Assets Cash Accounts receivable, net Merchandise inventory Prepaid expenses Plant assets, net Total assets Liabilities and Equity Accounts payable Current Year 1 Year Ago 2 Years Ago $ 30,000 86,600 110,500 10,450 279,000 $ 35,500 61,500 82,800 9,500 250,000 $ 516,550 $ 439,300 $ 129,200 Long-term notes payable 96,000 Common stock, $10 par value Retained earnings $ 74,500 100,000 162,500 102,300 Total liabilities and equity 162,500 128,850 $ 516,550 $ 439,300 $ 38,000 49,500 53,000 4,300 226,000 $ 370,800 $ 51,000 82,200 162,500 75,100 $ 370,800 The company's income statements for the Current Year and 1 Year Ago, follow. For Year Ended December 31 Sales Cost of goods sold Other operating expenses Income tax expense Interest expense Current Year 1 Year Ago $ 765,000 $ 620,000 $ 451,350 237,150 $ 384,400 148,800 13,500 8,800 11,600 9,550 709,650 $ 55,350 Total costs and expenses Net income Earnings per share $ 3.41 For both the Current Year and 1 Year Ago, compute the following ratios: 555,500 $ 64,500 $ 3.97 For both the Current Year and 1 Year Ago, compute the following ratios: (3-a) Compute return on total assets for the current year and one year ago. (3-b) Based on return on total assets, did Simon's operating efficiency improve or worsen in the Current Year versus 1 Year Ago? Complete this question by entering your answers in the tabs below. Required 3A Required 3B Compute return on total assets for the current year and one year ago. Current Year: 1 Year Ago: Assessment Tool iFrame Return On Total Assets Numerator: Denominator: = Return On Total Assets 1 = Return on total assets 1 = || % = % For both the Current Year and 1 Year Ago, compute the following ratios: (3-a) Compute return on total assets for the current year and one year ago. (3-b) Based on return on total assets, did Simon's operating efficiency improve or worsen in the Current Year versus 1 Year Ago? Complete this question by entering your answers in the tabs below. Required 3A Required 3B Based on return on total assets, did Simon's operating efficiency improve or worsen in the Current Year versus 1 Year Ago? Return on total assets
Expert Answer:

Related Book For 
Posted Date:
Students also viewed these finance questions
-
The foreman in a small assembly plant believes that playing classical music in the plant will improve worker productivity. To try to prove his point, the foreman conducts an experiment. He records...
-
Listed below are numbers of hospital admissions in one region due to traffic accidents on different Fridays falling on the 6th day of a month and the following 13th day of the month (based on data...
-
You are the tax advisor for TC Tours Ltd, a company engaged in the business of helicopter charter tours for eco tourists. The company has a fleet of helicopters which it acquired in 2016. In order to...
-
Find all values of 0, if 0 is in the interval [0, 360) and has the given function value. cot 0= -1 0= (Type your answer in degrees. Use a comma to separate answers as needed.)
-
Two chips are drawn without replacement from an urn containing five chips, numbered 1 through 5. The average of the two drawn is to be used as an estimator, , for the true average of all the chips (...
-
When Ramin was growing up in a small suburb of Boston, he was best friends with his cousin Saureb. Both boys played soccer on the same school team. Their parents even held joint birthday parties for...
-
Fill in the Blank. The power spectral density \(\mathrm{S}(\omega)\) of a stationary random process is defined as the transform of \(R(\tau) / 2 \pi\).
-
On July 1, Coastal Distribution Company is considering leasing a building and buying the necessary equipment to operate a public warehouse. Alternatively, the company could use the funds to invest in...
-
Calculate the return on investment (as a %) for the given company. (Round your answer to the nearest tenth of a percent.) Company Net Sales Cost of Goods Sold Gross Operating Profit Expenses a...
-
Write pseudocode to decode a message that has been encoded using the following algorithm. Step 1: Take three consecutive letters. Step 2: Reverse their order. Step 3: Interpret each as a base 26...
-
Prove by induction that the number of (unordered) pairs of integers between 0 and \(n-1\) is \(n(n-1) / 2\), and then prove by induction that the number of (unordered) triples of integers between 0...
-
Modify Lookup to make a program LookupMu1tiple that handles multiple values having the same key by storing all such values in a queue, as in Index, and then printing them all on a get request, as...
-
Safe password verification. Write a static method that takes a string as an argument and returns true if it meets the following conditions, false otherwise: At least eight characters long Contains...
-
Develop an implementation BinarySearchST of the symbol-table API that maintains parallel arrays of keys and values, keeping them in key-sorted order. Use binary search for get, and move larger...
-
Write a program that displays the color study shown at right, which gives Albers squares corresponding to each of the 256 levels of blue (blue-to-white in row major order) and gray (black-to-white in...
-
The purpose of the Veterinary Hospital Registration system is to handle and record all the information relating to the clients, veterinarians, pets, treatments administered, insurance coverage and...
-
d. The characteristic equation of a control system is given by s+2s+8s+12s+20s+16+16=0. Determine the number of the roots of the equation which lie on the imaginary axis of s-plane
-
Listed below are additional research questions and hypotheses from actual published articles. For each hypothesis, identify the independent and dependent variable. a. It is expected that achievement...
-
Name the scale of measurement (nominal, ordinal, interval, ratio) for each of the following variables: a. One's age (in years) b. Size of soft drink (small, medium, large, extra large) c. Voting...
-
A researcher hypothesizes that drivers who use cellular phones will get into a greater number of traffic accidents than drivers who do not use these phones. For this example, a. What are the...

Study smarter with the SolutionInn App