Answered step by step
Verified Expert Solution
Question
1 Approved Answer
Simulate a Prussian soldiers death by horse kick as in Example 3.8. Create a histogram based on 10,000 repetitions. Compare to a histogram of the
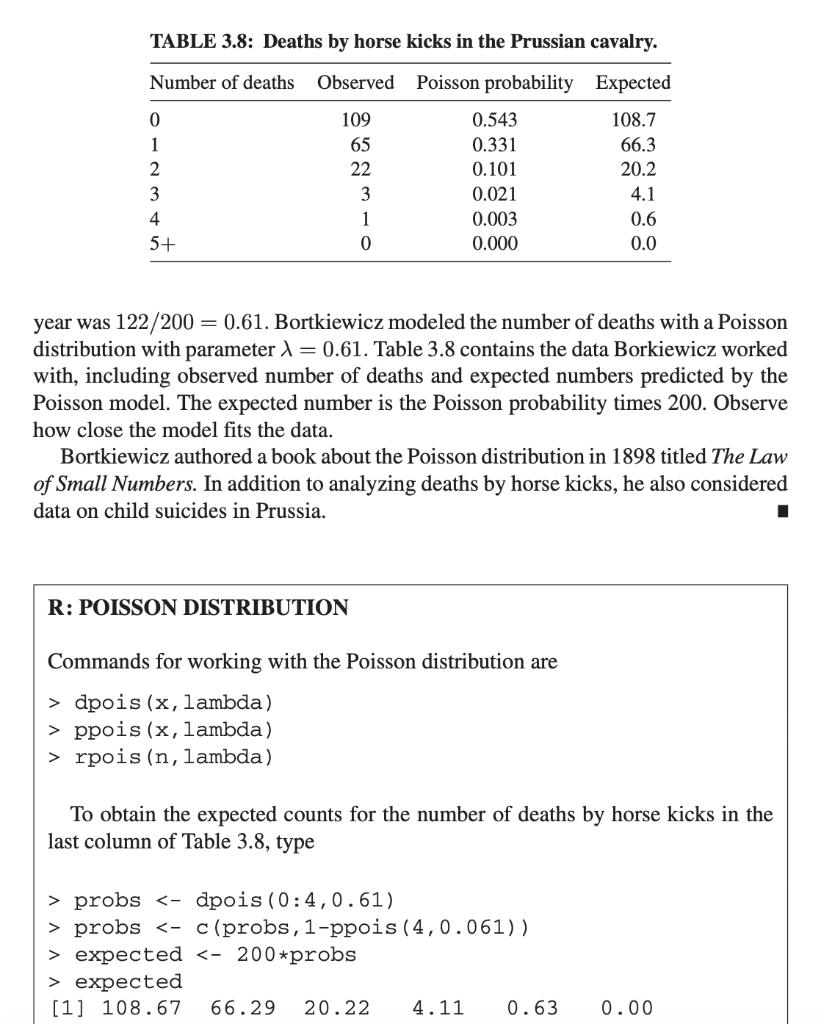
Simulate a Prussian soldier’s death by horse kick as in Example 3.8. Create a histogram based on 10,000 repetitions. Compare to a histogram of the Poisson distribution using the command rpois(10000,0.61).
TABLE 3.8: Deaths by horse kicks in the Prussian cavalry. Number of deaths Observed Poisson probability 109 65 22 0 1 2 3 4 5+ 3 1 0 0.543 0.331 0.101 0.021 0.003 0.000 R: POISSON DISTRIBUTION year was 122/200= 0.61. Bortkiewicz modeled the number of deaths with a Poisson distribution with parameter = 0.61. Table 3.8 contains the data Borkiewicz worked with, including observed number of deaths and expected numbers predicted by the Poisson model. The expected number is the Poisson probability times 200. Observe how close the model fits the data. Expected 108.7 66.3 20.2 4.1 0.6 0.0 Bortkiewicz authored a book about the Poisson distribution in 1898 titled The Law of Small Numbers. In addition to analyzing deaths by horse kicks, he also considered data on child suicides in Prussia. Commands for working with the Poisson distribution are >dpois (x, lambda) > ppois (x, lambda) > rpois (n, lambda) To obtain the expected counts for the number of deaths by horse kicks in the last column of Table 3.8, type > probs probs expected expected [1] 108.67 66.29 20.22 4.11 0.63 0.00
Step by Step Solution
★★★★★
3.61 Rating (165 Votes )
There are 3 Steps involved in it
Step: 1
Histogram of Poisson ...
Get Instant Access to Expert-Tailored Solutions
See step-by-step solutions with expert insights and AI powered tools for academic success
Step: 2

Step: 3

Ace Your Homework with AI
Get the answers you need in no time with our AI-driven, step-by-step assistance
Get Started


