

Question: simulate expected loss using Monte Carlo integration. (a) Consider the squared error loss function: L(a, y) = (ay). Compute and plot E(L(a, Y)) if
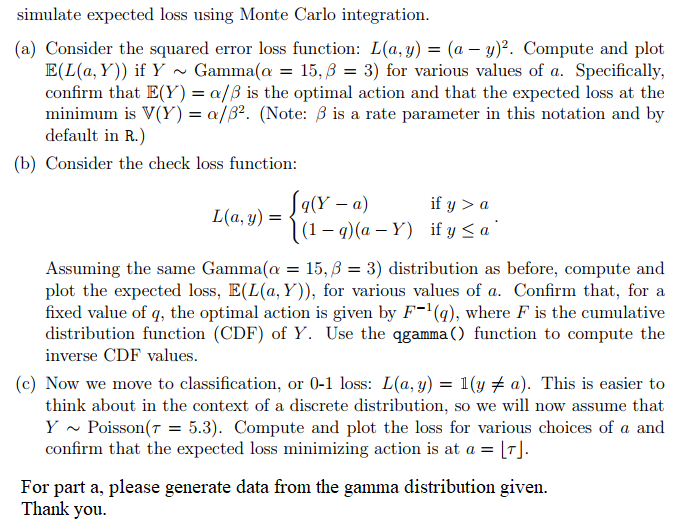
simulate expected loss using Monte Carlo integration. (a) Consider the squared error loss function: L(a, y) = (ay). Compute and plot E(L(a, Y)) if Y Gamma(a = 15, = 3) for various values of a. Specifically, confirm that E(Y) = a/ is the optimal action and that the expected loss at the minimum is V(Y) = a/. (Note: is a rate parameter in this notation and by default in R.) (b) Consider the check loss function: Ja(Y - a) L(a, y) = if y> a (19)(a Y) if ya Assuming the same Gamma(a = 15, = 3) distribution as before, compute and plot the expected loss, E(L(a, Y)), for various values of a. Confirm that, for a fixed value of q, the optimal action is given by F-1 (9), where F is the cumulative distribution function (CDF) of Y. Use the qgamma () function to compute the inverse CDF values. (c) Now we move to classification, or 0-1 loss: L(a, y) = 1(ya). This is easier to think about in the context of a discrete distribution, so we will now assume that YPoisson (75.3). Compute and plot the loss for various choices of a and confirm that the expected loss minimizing action is at a = [7]. For part a, please generate data from the gamma distribution given. Thank you.
Step by Step Solution
There are 3 Steps involved in it

Get step-by-step solutions from verified subject matter experts