

Question: Simulate the below in matlab with the values given there. Plot the steady state solution and the state propagation with 100 and 200 simulations.(dlyap) Need
Simulate the below in matlab with the values given there. Plot the steady state solution and the state propagation with 100 and 200 simulations.(dlyap) Need to get the MATLAB code that produces the below graphs
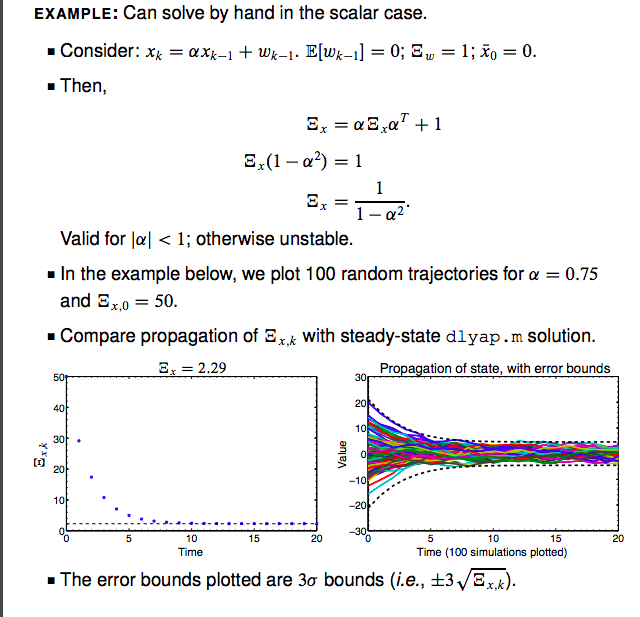
EXAMPLE: Can solve by hand in the scalar case Then, Valid for l
Step by Step Solution
There are 3 Steps involved in it
1 Expert Approved Answer
Step: 1 Unlock

Question Has Been Solved by an Expert!
Get step-by-step solutions from verified subject matter experts
Step: 2 Unlock
Step: 3 Unlock