

Question: (Simulation and Modelling)4. A drive-in restaurant where carhops take orders and bring food to the car. Assumptions; (30p) Please answer,not a really difficult question. There
(Simulation and Modelling)4. A drive-in restaurant where carhops take orders and bring food to the car. Assumptions; (30p) Please answer,not a really difficult question.
- There are three services A, B and C. Service-C will replace it if any service is broken.
- A simplifying rule is that Service-A gets the customer if both carhops (Service A and B) are idle.
- If both are busy, the customer begins service with the first server to become free.
- Service-A breaks in the 29th minute. And after 5 minutes, Service-C begins the service time instead of Service-A.
-
a) Find the average waiting time for a customer.
b) Find the probability that a customer has to wait in the queue.
c) Which customer was being serviced when server was broken?
d) Which service is the most busy? Find the probability of the servers being busy?
e) Find the average time a customer spends in the system.
f) How many customers have service when a 1 hour work simulation is done?
g) Show the time between arrivals with histogram bar.
-
You can reference this tables.I already filled it but i am not sure.(For example I considered table1 in the first row random digit assignment 0-14 but can be at 1-15)
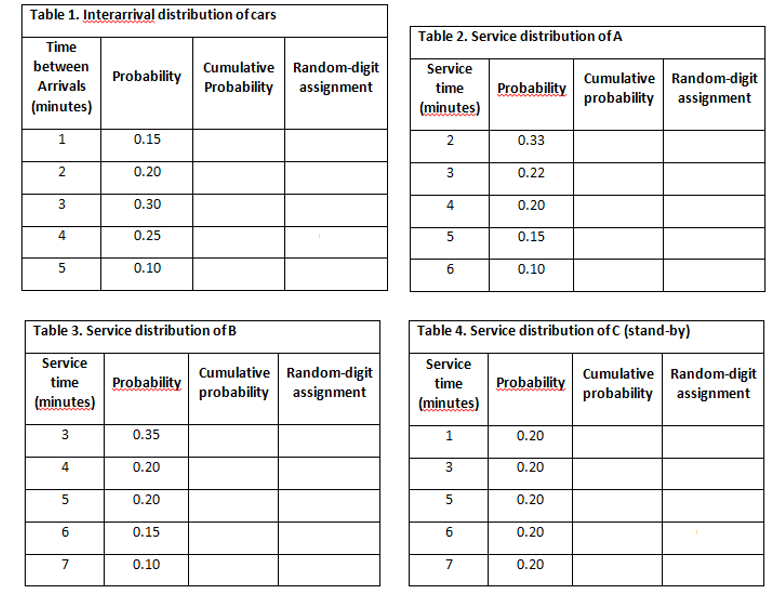
Table 1. Interarrival distribution of cars Table 2. Service distribution of A Time between Arrivals (minutes) Probability Cumulative Random-digit Probability assignment Service time (minutes) Probability Cumulative Random-digit probability assignment 0.15 2 0.33 1 2. 0.20 3 0.22 3 0.30 4 0.20 4 0.25 5 0.15 5 0.10 6 0.10 Table 3. Service distribution of B Table 4. Service distribution of C (stand-by) Service time (minutes) Probability Cumulative Random-digit probability assignment Service time (minutes) Probability Cumulative Random-digit probability assignment 3 0.35 1 0.20 4 0.20 3 0.20 5 0.20 5 0.20 6 0.15 6 0.20 7 0.10 7 0.20 Table 1. Interarrival distribution of cars Table 2. Service distribution of A Time between Arrivals (minutes) Probability Cumulative Random-digit Probability assignment Service time (minutes) Probability Cumulative Random-digit probability assignment 0.15 2 0.33 1 2. 0.20 3 0.22 3 0.30 4 0.20 4 0.25 5 0.15 5 0.10 6 0.10 Table 3. Service distribution of B Table 4. Service distribution of C (stand-by) Service time (minutes) Probability Cumulative Random-digit probability assignment Service time (minutes) Probability Cumulative Random-digit probability assignment 3 0.35 1 0.20 4 0.20 3 0.20 5 0.20 5 0.20 6 0.15 6 0.20 7 0.10 7 0.20
Step by Step Solution
There are 3 Steps involved in it

Get step-by-step solutions from verified subject matter experts