

Question: Simulation Holland believes that simulation is a useful approach to assess various inven- tory control alternatives. The historical data from Table 9.3 could be
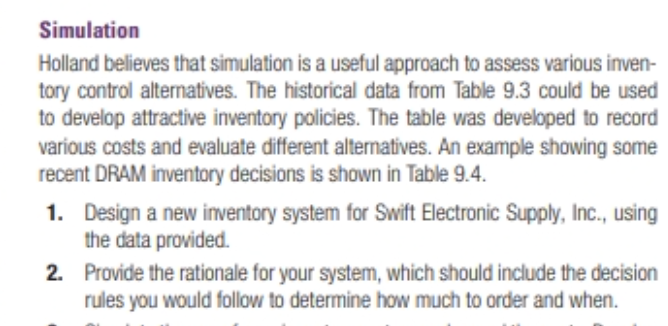
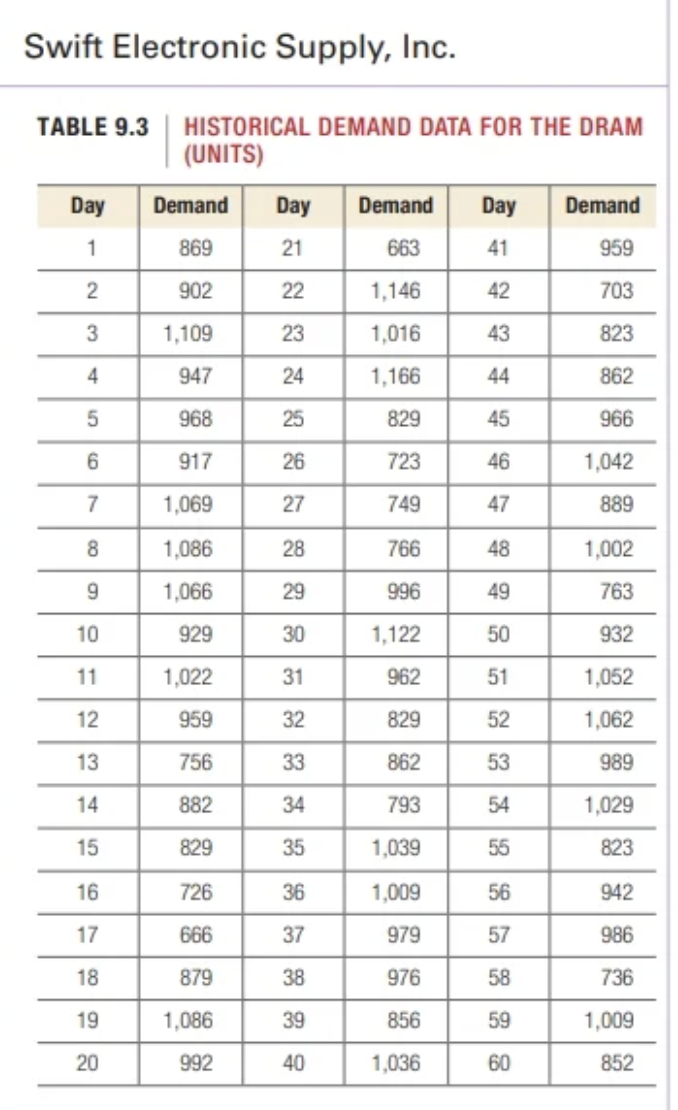
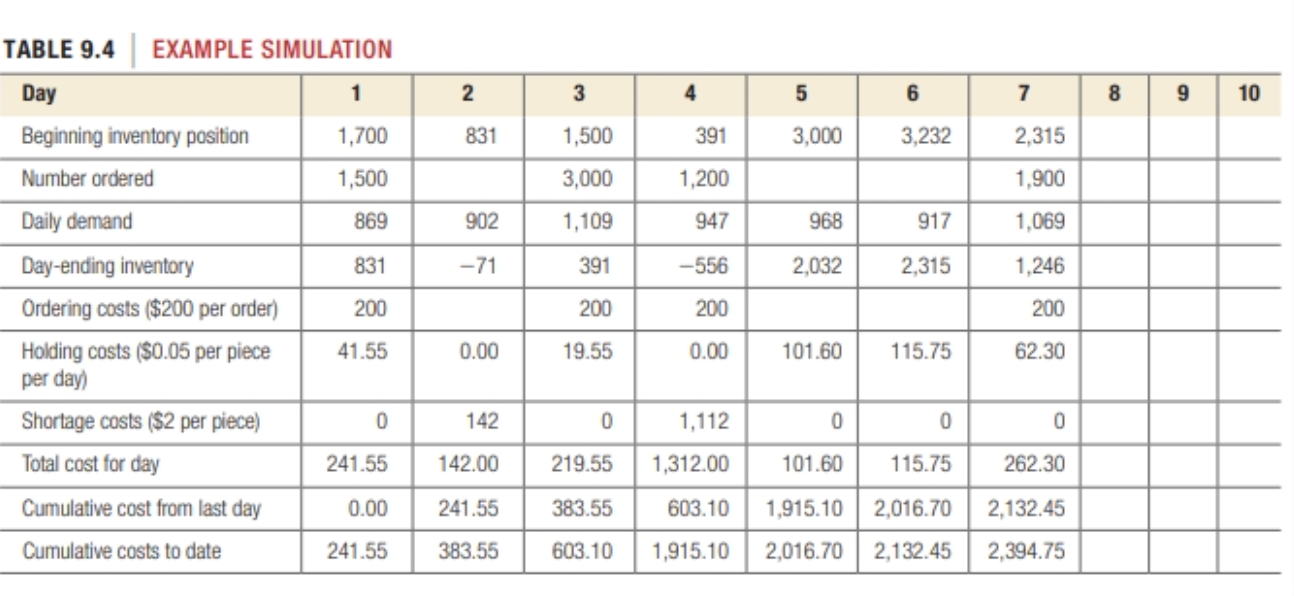
Simulation Holland believes that simulation is a useful approach to assess various inven- tory control alternatives. The historical data from Table 9.3 could be used to develop attractive inventory policies. The table was developed to record various costs and evaluate different alternatives. An example showing some recent DRAM inventory decisions is shown in Table 9.4. 1. Design a new inventory system for Swift Electronic Supply, Inc., using the data provided. 2. Provide the rationale for your system, which should include the decision rules you would follow to determine how much to order and when. Swift Electronic Supply, Inc. TABLE 9.3 HISTORICAL DEMAND DATA FOR THE DRAM (UNITS) Day Demand Day Demand Day Demand 1 869 21 663 41 959 2 902 22 1,146 42 703 3 1,109 23 1,016 43 823 4 947 24 1,166 44 862 5 968 25 829 45 966 6 917 26 723 46 1,042 7 1,069 27 749 47 889 8 1,086 28 766 48 1,002 9 1,066 29 996 49 763 10 929 30 1,122 50 932 11 1,022 31 962 51 1,052 12 959 32 829 52 1,062 13 756 33 862 53 989 14 882 34 793 54 1,029 15 829 35 1,039 55 823 16 726 36 1,009 56 942 17 666 37 979 57 986 18 879 38 976 58 736 19 1,086 39 856 59 1,009 20 20 992 40 1,036 60 852 TABLE 9.4 | EXAMPLE SIMULATION Day 1 2 3 4 5 6 7 8 9 10 Beginning inventory position 1,700 831 31 1,500 391 3,000 3,232 2,315 Number ordered 1,500 3,000 1,200 1,900 Daily demand 869 902 1,109 947 968 917 1,069 Day-ending inventory 831 -71 391 -556 2,032 2,315 1,246 Ordering costs ($200 per order) 200 200 200 200 Holding costs ($0.05 per piece 41.55 0.00 19.55 0.00 101.60 115.75 62.30 per day) Shortage costs ($2 per piece) 0 142 0 1,112 0 0 0 Total cost for day 241.55 142.00 219.55 1,312.00 101.60 115.75 262.30 Cumulative cost from last day 0.00 241.55 383.55 603.10 1,915.10 2,016.70 2,132.45 Cumulative costs to date 241.55 383.55 603.10 1,915.10 2,016.70 2,132.45 2,394.75
Step by Step Solution
There are 3 Steps involved in it

Get step-by-step solutions from verified subject matter experts