

Question: Since categorical variables like type whose values (levels) are given in words (not numbers) are directly treated as factors in R, R generates dummy variables
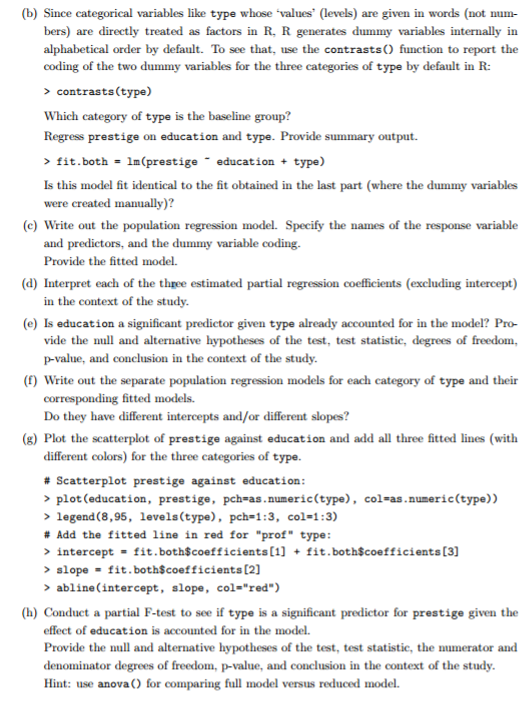
Since categorical variables like type whose values (levels) are given in words (not numbers) are directly treated as factors in R, R generates dummy variables internally in alphabetical order by default. To see that, use the contrasts() function to report the coding of the two dummy variables for the three categories of type by default in R: > contrasts(type) Which category of type is the baseline group? Regress prestige on education and type. Provide summary output. > fit.both = 1m(prestige^- education + type) Is this model fit identical to the fit obtained in the last part (where the dummy variables were created manually)? Write out the population regression model. Specify the names of the response variable and predictors, and the dummy variable coding. Provide the fitted model. Interpret each of the three estimated partial regression coefficients (excluding intercept) in the context of the study. Is education a significant predictor given type already accounted for in the model? Provide the null and alternative hypotheses of the test, test statistic, degrees of freedom p-value, and conclusion in the context of the study. Write out the separate population regression models for each category of type and their corresponding fitted models. Do they have different intercepts and/or different slopes? Plot the scatterplot of prestige against education and add all three fitted lines (with different colors) for the three categories of type. # Scatterplot prestige against education: > plot (education, prestige, pch=as.numeric(type), col=as.numeric(type)) > legend (8, 95, levels (type), pch=1:3, col=1:3) # Add the fitted line in red for "prof" type: > intercept = fit both$coefficients[1] + fit.both$coefficients[3] > slope = fit.both$coefficients [2] > abline (intercept, slope, col="red") Conduct a partial F-test to see if type is a significant predictor for prestige given the effect of education is accounted for in the model Provide the null and alternative hypotheses of the test, test statistic, the numerator and denominator degrees of freedom, p-value, and conclusion in the context of the study. Since categorical variables like type whose values (levels) are given in words (not numbers) are directly treated as factors in R, R generates dummy variables internally in alphabetical order by default. To see that, use the contrasts() function to report the coding of the two dummy variables for the three categories of type by default in R: > contrasts(type) Which category of type is the baseline group? Regress prestige on education and type. Provide summary output. > fit.both = 1m(prestige^- education + type) Is this model fit identical to the fit obtained in the last part (where the dummy variables were created manually)? Write out the population regression model. Specify the names of the response variable and predictors, and the dummy variable coding. Provide the fitted model. Interpret each of the three estimated partial regression coefficients (excluding intercept) in the context of the study. Is education a significant predictor given type already accounted for in the model? Provide the null and alternative hypotheses of the test, test statistic, degrees of freedom p-value, and conclusion in the context of the study. Write out the separate population regression models for each category of type and their corresponding fitted models. Do they have different intercepts and/or different slopes? Plot the scatterplot of prestige against education and add all three fitted lines (with different colors) for the three categories of type. # Scatterplot prestige against education: > plot (education, prestige, pch=as.numeric(type), col=as.numeric(type)) > legend (8, 95, levels (type), pch=1:3, col=1:3) # Add the fitted line in red for "prof" type: > intercept = fit both$coefficients[1] + fit.both$coefficients[3] > slope = fit.both$coefficients [2] > abline (intercept, slope, col="red") Conduct a partial F-test to see if type is a significant predictor for prestige given the effect of education is accounted for in the model Provide the null and alternative hypotheses of the test, test statistic, the numerator and denominator degrees of freedom, p-value, and conclusion in the context of the study
Step by Step Solution
There are 3 Steps involved in it

Get step-by-step solutions from verified subject matter experts