

Question: (Single Queue, Single Server System Hand Simulation) The following data show the arrival times and service times (in minutes) of 10 customers. Performance measures are
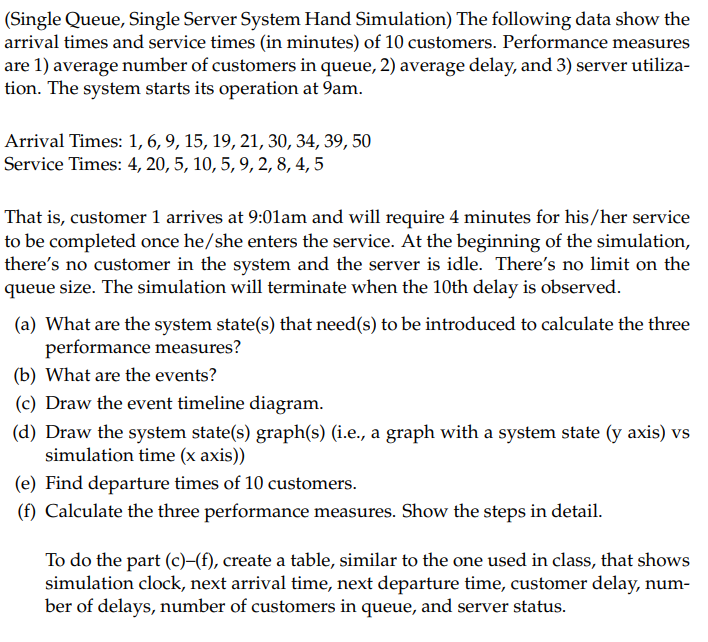
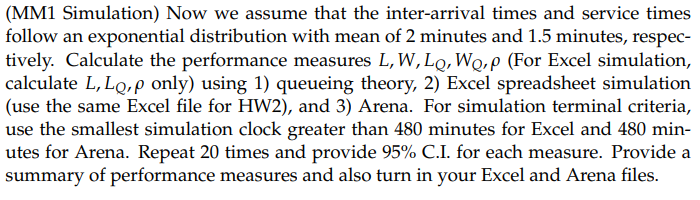
(Single Queue, Single Server System Hand Simulation) The following data show the arrival times and service times (in minutes) of 10 customers. Performance measures are 1) average number of customers in queue, 2) average delay, and 3) server utilization. The system starts its operation at 9am. Arrival Times: 1, 6, 9, 15, 19, 21, 30, 34, 39, 50 Service Times: 4, 20, 5, 10, 5, 9, 2, 8, 4, 5 That is, customer 1 arrives at 9:01am and will require 4 minutes for his/her service to be completed once he/she enters the service. At the beginning of the simulation, there's no customer in the system and the server is idle. There's no limit on the queue size. The simulation will terminate when the 10th delay is observed. (a) What are the system state(s) that need(s) to be introduced to calculate the three performance measures? (b) What are the events? (c) Draw the event timeline diagram. (d) Draw the system state(s) graph(s) (i.e., a graph with a system state (y axis) vs simulation time ( x axis)) (e) Find departure times of 10 customers. (f) Calculate the three performance measures. Show the steps in detail. To do the part (c)-(f), create a table, similar to the one used in class, that shows simulation clock, next arrival time, next departure time, customer delay, number of delays, number of customers in queue, and server status. (MM1 Simulation) Now we assume that the inter-arrival times and service times follow an exponential distribution with mean of 2 minutes and 1.5 minutes, respectively. Calculate the performance measures L,W,LQ,WQ, (For Excel simulation, calculate L,LQ, only) using 1 ) queueing theory, 2) Excel spreadsheet simulation (use the same Excel file for HW2), and 3) Arena. For simulation terminal criteria, use the smallest simulation clock greater than 480 minutes for Excel and 480 minutes for Arena. Repeat 20 times and provide 95\% C.I. for each measure. Provide a summary of performance measures and also turn in your Excel and Arena files
Step by Step Solution
There are 3 Steps involved in it

Get step-by-step solutions from verified subject matter experts