

Sitting down in your office, coffee in hand, you jot down some questions you think might...
Fantastic news! We've Found the answer you've been seeking!
Question:
Transcribed Image Text:
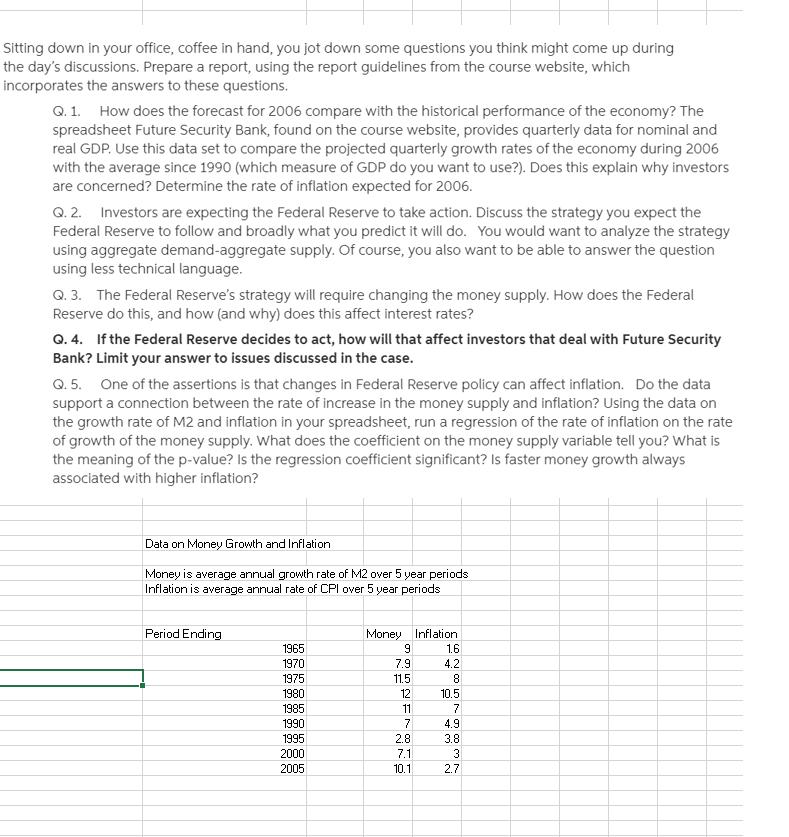
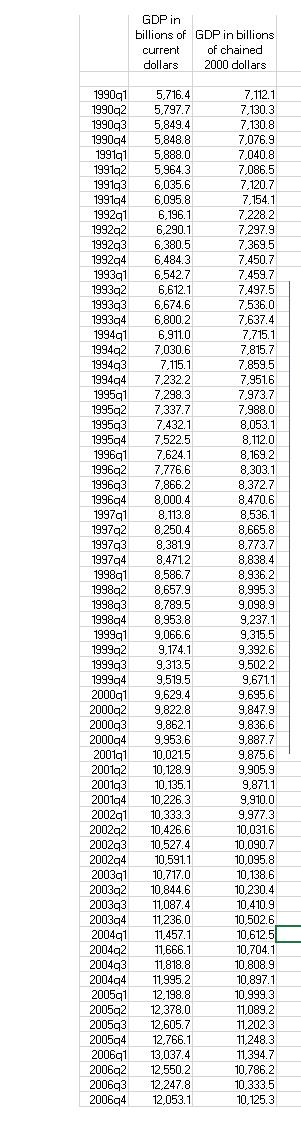
Sitting down in your office, coffee in hand, you jot down some questions you think might come up during the day's discussions. Prepare a report, using the report guidelines from the course website, which incorporates the answers to these questions. Q. 1. How does the forecast for 2006 compare with the historical performance of the economy? The spreadsheet Future Security Bank, found on the course website, provides quarterly data for nominal and real GDP. Use this data set to compare the projected quarterly growth rates of the economy during 2006 with the average since 1990 (which measure of GDP do you want to use?). Does this explain why investors are concerned? Determine the rate of inflation expected for 2006. Q. 2. Investors are expecting the Federal Reserve to take action. Discuss the strategy you expect the Federal Reserve to follow and broadly what you predict it will do. You would want to analyze the strategy using aggregate demand-aggregate supply. Of course, you also want to be able to answer the question using less technical language. Q. 3. The Federal Reserve's strategy will require changing the money supply. How does the Federal Reserve do this, and how (and why) does this affect interest rates? Q. 4. If the Federal Reserve decides to act, how will that affect investors that deal with Future Security Bank? Limit your answer to issues discussed in the case. Q. 5. One of the assertions is that changes in Federal Reserve policy can affect inflation. Do the data support a connection between the rate of increase in the money supply and inflation? Using the data on the growth rate of M2 and inflation in your spreadsheet, run a regression of the rate of inflation on the rate of growth of the money supply. What does the coefficient on the money supply variable tell you? What is the meaning of the p-value? Is the regression coefficient significant? Is faster money growth always associated with higher inflation? Data on Money Growth and Inflation Money is average annual growth rate of M2 over 5 year periods Inflation is average annual rate of CPI over 5 year periods Period Ending 1965 1970 1975 1980 1985 1990 1995 2000 2005 Money Inflation 9 1.6 4.2 8 NE 7.9 in in NG66 11.5 12 11 NNO 7 2.8 7.1 10.1 10.5 000 comm M 7 4.9 3.8 3 2.7 GDP in billions of current dollars 1990q1 5,716.4 199092 5,797.7 1990q3 5,849.4 1990q4 5,848.8 1991q1 5,888.0 1991q2 5,964.3 1991q3 6,035.6 199194 6,095.8 1992q1 6,196.1 1992q2 6,290.1 1992q3 6,380.5 1992q4 6,484.3 1993q1 6,542.7 1993q2 6,612.1 1993q3 6,674.6 1993q4 6,800.2 1994q1 6,911.0 1994q2 7,030.6 1994q3 7,115.1 1994q4 7,232.2 1995q1 7,298.3 1995q2 7,337.7 1995q3 7,432.1 1995q4 7,522.5 1996q1 7,624.1 1996q2 7,776.6 1996q3 7,866.2 1996q4 8,000.4 1997q1 8,113.8 1997q2 8,250.4 1997q3 8,381.9 1997q4 8,471,2 1998a1 8.586.7 1998q2 8,657.9 1998q3 8,789.5 1998q4 8,953.8 1999q1 9,066.6 9,174.1 1999q2 1999q3 1999q4 2000q1 9,629.4 2000g2 9,822.8 9,313.5 9,519.5 2000q3 9,862.1 2000q4 9,953.6 2001q1 10,021.5 2001q2 10.128.9 2001q3 10,135.1 2001q4 10,226.3 2002q1 10,333.3 2002q2 10,426.6 2002q3 10,527.4 2002q4 10,591.1 2003g1 10,717.0 2003q2 10,844.6 2003q3 11,087.4 2003q4 11,236.0 2004q1 11,457.1 2004q2 11,666.1 2004q3 11,818.8 2004g4 11,995.2 2005q1 12,198.8 2005q2 12,378.0 12,605.7 2005q3 2005q4 12,766.1 2006q1 13,037.4 2006q2 12,550.2 2006q3 12,247.8 2006q4 12,053.1 GDP in billions of chained 2000 dollars 7.112.1 7,130.3 7,130.8 7.076.9 7,040.8 7,086.5 7,120.7 7,154.1 7,228.2 7,297,9 7,369.5 7.450.7 7,459.7 7,497.5 7,536.0 7,637.4 7,715.1 7,815.7 7,859.5 7,951.6 7,973.7 7,988.0 8,053.1 8,112.0 8,169.2 8,303.1 8,372.7 8,470.6 8,536.1 8,665.8 8,773.7 8,838.4 8,936.2 8,995.3 9,098.9 9,237.1 9,315.5 9,392.6 9,502.2 9,671.1 9,695.6 9,847.9 9,836.6 9,887.7 9,875.6 9,905.9 9,871.1 9.910.0 9,977.3 10,031.6 10,090.7 10,095.8 10,138.6 10,230.4 10,410.9 10,502.6 10.612.5 10,704. 10,808.9 10,897,1 10,999.3 11,089.2 11,202.3 11,248.3 11,394.7 10,786.2 10.333.5 10,125.3 Sitting down in your office, coffee in hand, you jot down some questions you think might come up during the day's discussions. Prepare a report, using the report guidelines from the course website, which incorporates the answers to these questions. Q. 1. How does the forecast for 2006 compare with the historical performance of the economy? The spreadsheet Future Security Bank, found on the course website, provides quarterly data for nominal and real GDP. Use this data set to compare the projected quarterly growth rates of the economy during 2006 with the average since 1990 (which measure of GDP do you want to use?). Does this explain why investors are concerned? Determine the rate of inflation expected for 2006. Q. 2. Investors are expecting the Federal Reserve to take action. Discuss the strategy you expect the Federal Reserve to follow and broadly what you predict it will do. You would want to analyze the strategy using aggregate demand-aggregate supply. Of course, you also want to be able to answer the question using less technical language. Q. 3. The Federal Reserve's strategy will require changing the money supply. How does the Federal Reserve do this, and how (and why) does this affect interest rates? Q. 4. If the Federal Reserve decides to act, how will that affect investors that deal with Future Security Bank? Limit your answer to issues discussed in the case. Q. 5. One of the assertions is that changes in Federal Reserve policy can affect inflation. Do the data support a connection between the rate of increase in the money supply and inflation? Using the data on the growth rate of M2 and inflation in your spreadsheet, run a regression of the rate of inflation on the rate of growth of the money supply. What does the coefficient on the money supply variable tell you? What is the meaning of the p-value? Is the regression coefficient significant? Is faster money growth always associated with higher inflation? Data on Money Growth and Inflation Money is average annual growth rate of M2 over 5 year periods Inflation is average annual rate of CPI over 5 year periods Period Ending 1965 1970 1975 1980 1985 1990 1995 2000 2005 Money Inflation 9 1.6 4.2 8 NE 7.9 in in NG66 11.5 12 11 NNO 7 2.8 7.1 10.1 10.5 000 comm M 7 4.9 3.8 3 2.7 GDP in billions of current dollars 1990q1 5,716.4 199092 5,797.7 1990q3 5,849.4 1990q4 5,848.8 1991q1 5,888.0 1991q2 5,964.3 1991q3 6,035.6 199194 6,095.8 1992q1 6,196.1 1992q2 6,290.1 1992q3 6,380.5 1992q4 6,484.3 1993q1 6,542.7 1993q2 6,612.1 1993q3 6,674.6 1993q4 6,800.2 1994q1 6,911.0 1994q2 7,030.6 1994q3 7,115.1 1994q4 7,232.2 1995q1 7,298.3 1995q2 7,337.7 1995q3 7,432.1 1995q4 7,522.5 1996q1 7,624.1 1996q2 7,776.6 1996q3 7,866.2 1996q4 8,000.4 1997q1 8,113.8 1997q2 8,250.4 1997q3 8,381.9 1997q4 8,471,2 1998a1 8.586.7 1998q2 8,657.9 1998q3 8,789.5 1998q4 8,953.8 1999q1 9,066.6 9,174.1 1999q2 1999q3 1999q4 2000q1 9,629.4 2000g2 9,822.8 9,313.5 9,519.5 2000q3 9,862.1 2000q4 9,953.6 2001q1 10,021.5 2001q2 10.128.9 2001q3 10,135.1 2001q4 10,226.3 2002q1 10,333.3 2002q2 10,426.6 2002q3 10,527.4 2002q4 10,591.1 2003g1 10,717.0 2003q2 10,844.6 2003q3 11,087.4 2003q4 11,236.0 2004q1 11,457.1 2004q2 11,666.1 2004q3 11,818.8 2004g4 11,995.2 2005q1 12,198.8 2005q2 12,378.0 12,605.7 2005q3 2005q4 12,766.1 2006q1 13,037.4 2006q2 12,550.2 2006q3 12,247.8 2006q4 12,053.1 GDP in billions of chained 2000 dollars 7.112.1 7,130.3 7,130.8 7.076.9 7,040.8 7,086.5 7,120.7 7,154.1 7,228.2 7,297,9 7,369.5 7.450.7 7,459.7 7,497.5 7,536.0 7,637.4 7,715.1 7,815.7 7,859.5 7,951.6 7,973.7 7,988.0 8,053.1 8,112.0 8,169.2 8,303.1 8,372.7 8,470.6 8,536.1 8,665.8 8,773.7 8,838.4 8,936.2 8,995.3 9,098.9 9,237.1 9,315.5 9,392.6 9,502.2 9,671.1 9,695.6 9,847.9 9,836.6 9,887.7 9,875.6 9,905.9 9,871.1 9.910.0 9,977.3 10,031.6 10,090.7 10,095.8 10,138.6 10,230.4 10,410.9 10,502.6 10.612.5 10,704. 10,808.9 10,897,1 10,999.3 11,089.2 11,202.3 11,248.3 11,394.7 10,786.2 10.333.5 10,125.3
Expert Answer:
Answer rating: 100% (QA)
The images provided include a set of questions and some data tables The questions relate to analyzing economic data specifically about GDP growth projected economic performance compared to historical ... View the full answer

Related Book For 

Fraud examination
ISBN: 978-0538470841
4th edition
Authors: Steve Albrecht, Chad Albrecht, Conan Albrecht, Mark zimbelma
Posted Date:
Students also viewed these finance questions
-
The water in a shallow pond heats up during the day and cools down during the night. Heat transfer by radiation, conduction and convection with the ambient thus cycles the water temperature. Is such...
-
Using the table below: 1. Calculate nominal and real GDP in 2015 assuming the base year is 2015. 2. Calculate nominal and real GDP in 2017 assuming the base year is 2015. 3. Calculate the GDP...
-
Explain the difference between nominal and real GDP and why real GDP is necessary to compare prior years data?
-
B-bol King Co. started a new promotional program. For every 10 box tops returned, customers receive a basketball. The entity estimated that only 60% of the box tops reaching the market will be...
-
An industrial plant has a requirement for a circuit that uses as input the temperature of a vessel and outputs a voltage proportional to be vessel?s temperature. The vessel?s temperature ranges from...
-
Recent articles in the business press have reported that many employers are treating direct labor as a true variable cost. Employees are hired and laid of` regularly as the employer's needs dictate....
-
Explain why it is unhealthy for a company to invest its cash in shares.
-
An aqueous slum? at 30?C containing 20.0 wt% solids is fed to an evaporator in which enough water is vaporized at 1 atm to produce a product slurry containing 35.0 wt% solids. Heat is supplied to the...
-
Solve the following minimization problem by solving the-primal problem with the simplex method Minimize g=10y;+4y2 subject to 3y1-2y2217 21+32223 A Minimum: g=120 at y =10,y2=5 B Minimum: g=110 at...
-
Table 1 shows Apple's online orders for the last week. When shoppers place an online order, several "recommended products" (upsells) are shown as at checkout an attempt to upsell See table 2 in cell...
-
Discuss the relationship among projects, programs and portfolio management and the contributions that each make to the success of an IT based enterprise
-
There are 6 ethical values that marketers are expected to uphold, and these are: Honesty - Be forthright in dealings and offer value and integrity. Responsibility - Accept the consequences of...
-
The TimpRiders LP has operated a motorcycle dealership for a number of years. Lance is the limited partner, Francesca is the general partner, and they share capital and profits equally. Francesca...
-
What strategies can HR leaders employ to foster a culture of continuous learning and skill development in response to the accelerating pace of technological change ?
-
An electrical lamp is rated 120 volts, 500 watts. If the voltage applied across the lamp is twice the rated voltage, compute the current that flows through the lamp. Give the per unit equivalent...
-
A solution consists of 54.2 g of silver nitrate, AgNO3, and 83.8g water and has a density of 1.46 g/mL. Calculate the weightpercent of AgNO3, the molality of AgNO3, the mole fraction ofAgNO3, and the...
-
Wesley Power Tools manufactures a wide variety of tools and accessories. One of its more popular items is a cordless power handisaw. Each handisaw sells for $46. Wesley expects the following unit...
-
Assume a simple Keynesian depression economy with a multiplier of 4 and an initial equilibrium income of $3,000. Saving and investment equal $400, and assume full employment income is $4,000. a. What...
-
(Multiple choice) 1. Using a subtly different Internet host name to mimic another business is known as: a. Spoofing. b. Sniffing. c. Web-visit hijacking. d. Falsified identity. 2. Passwords and...
-
The Gramm-Leach-Bliley Act protects against the use of false pretenses. In what ways did this act have positive investigative consequences?
-
Pablo is studying financial statements to decide which companies would be wise investments. Pablo identifies Jawanna Corporation as having abnormally high financial ratios compared with other...
-
Refer to Exhibits 4-4 and 4-5. Suppose manufacturing costs were the same, but there was an ending work-in-process inventory of $3 million. The cost of the completed goods would therefore be $37...
-
Ithalid Company began business on January 1, 2006, with assets of $150,000 cash and equity of $150,000 capital shares. In 2006 it manufactured some inventory at a cost of $60,000, including $12,000...
-
Blackstone Tools produced 12,000 electric drills during 2006, although expected production was only 10,500 drills. The companys fixed overhead rate is $7 per drill. Absorption-costing operating...

Study smarter with the SolutionInn App