

Question: Six samples with individual observations have been collected on the oxide thickness of silicon wafers, as shown in the following table Sample 54.3 57
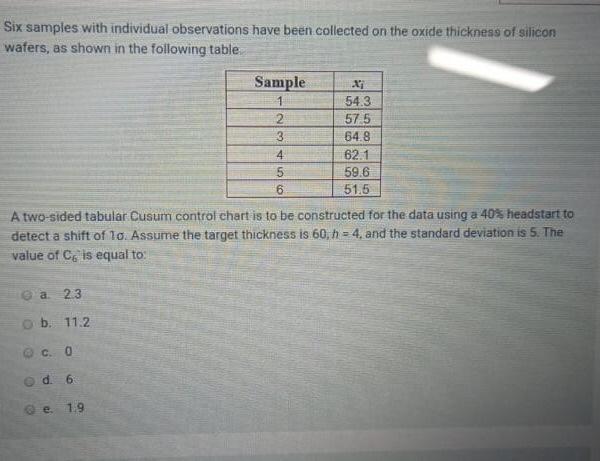
Six samples with individual observations have been collected on the oxide thickness of silicon wafers, as shown in the following table Sample 54.3 57 5 3 64.8 4 62.1 5. 59.6 6. 51.5 A two-sided tabular Cusum control chart is to be constructed for the data using a 40% headstart to detect a shift of lo. Assume the target thickness is 60, h = 4, and the standard deviation is 5. The value of Ce is equal to Oa 23 b. 11.2 C. 0 d. 6 e. 1.9
Step by Step Solution
★★★★★
3.39 Rating (152 Votes )
There are 3 Steps involved in it
1 Expert Approved Answer
Step: 1 Unlock

Question Has Been Solved by an Expert!
Get step-by-step solutions from verified subject matter experts
Step: 2 Unlock
Step: 3 Unlock