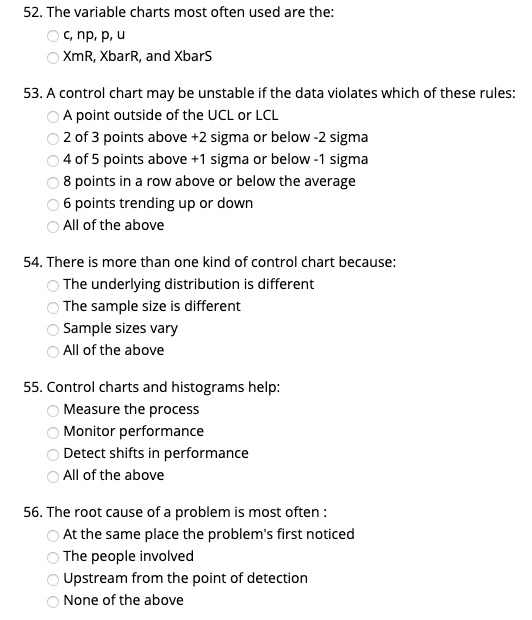
Question: Six Sigma White Belt 52. The variable charts most often used are the: C, np, p, u XmR, Xbarr, and Xbars 53. A control chart

Six Sigma White Belt

Six Sigma White Belt 52. The variable charts most

52. The variable charts most often used are the: C, np, p, u XmR, Xbarr, and Xbars 53. A control chart may be unstable if the data violates which of these rules: A point outside of the UCL or LCL 2 of 3 points above +2 sigma or below -2 sigma 4 of 5 points above +1 sigma or below -1 sigma 8 points in a row above or below the average 6 points trending up or down All of the above 54. There is more than one kind of control chart because: The underlying distribution is different The sample size is different Sample sizes vary All of the above 55. Control charts and histograms help: Measure the process Monitor performance Detect shifts in performance All of the above 56. The root cause of a problem is most often: At the same place the problem's first noticed The people involved Upstream from the point of detection None of the above

Step by Step Solution

There are 3 Steps involved in it

1 Expert Approved Answer
Step: 1 Unlock blur-text-image
Question Has Been Solved by an Expert!

Get step-by-step solutions from verified subject matter experts

Step: 2 Unlock
Step: 3 Unlock

Students Have Also Explored These Related General Management Questions!