

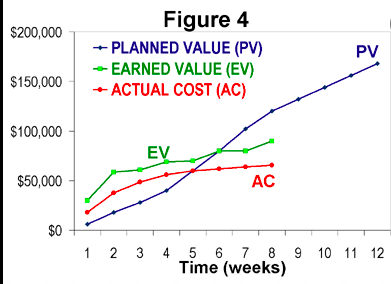
Question: Sketch an earned value chart like the following example using the following data for month 1 to graph an estimation over 12 weeks. PV =
Sketch an earned value chart like the following example
using the following data for month 1 to graph an estimation over 12 weeks.
PV = $26,080
EV= $14,334
AC= $16,930
Value Chart Sample - "Do not use these numbers in the sample"
Step by Step Solution
There are 3 Steps involved in it
1 Expert Approved Answer
Step: 1 Unlock

Question Has Been Solved by an Expert!
Get step-by-step solutions from verified subject matter experts
Step: 2 Unlock
Step: 3 Unlock