

Question: Sketch the region corresponding to the statement P(z > 1.3) Shade: Left of a value V Click and drag the arrows to adjust the values.
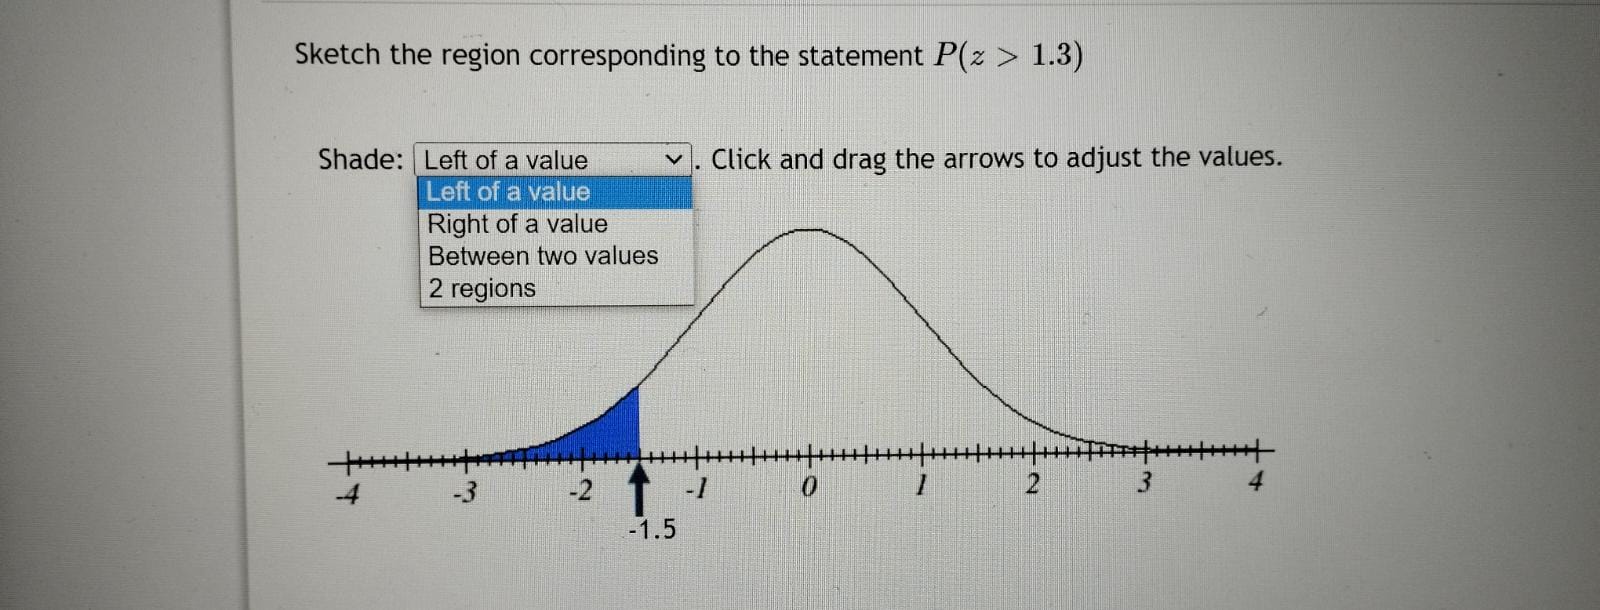
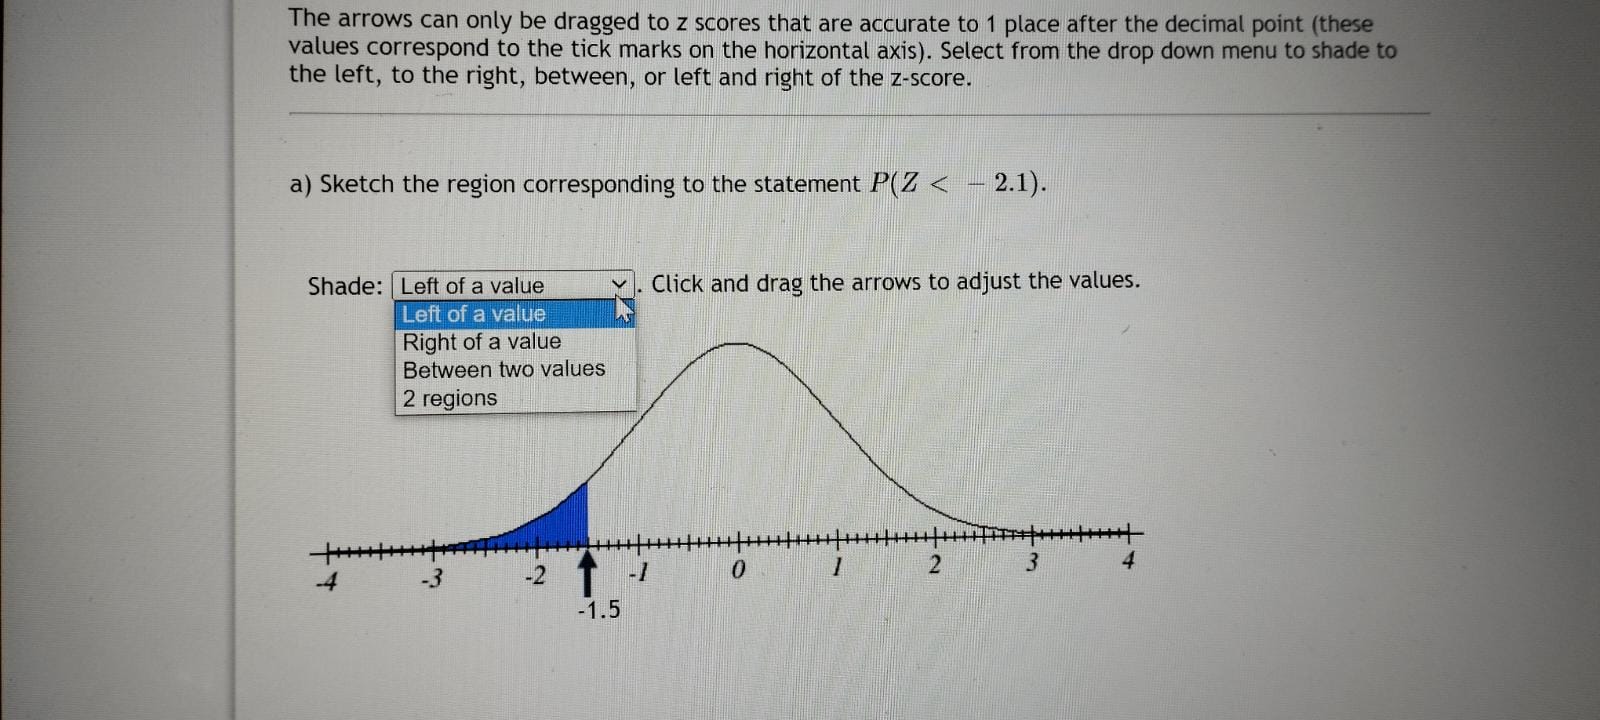
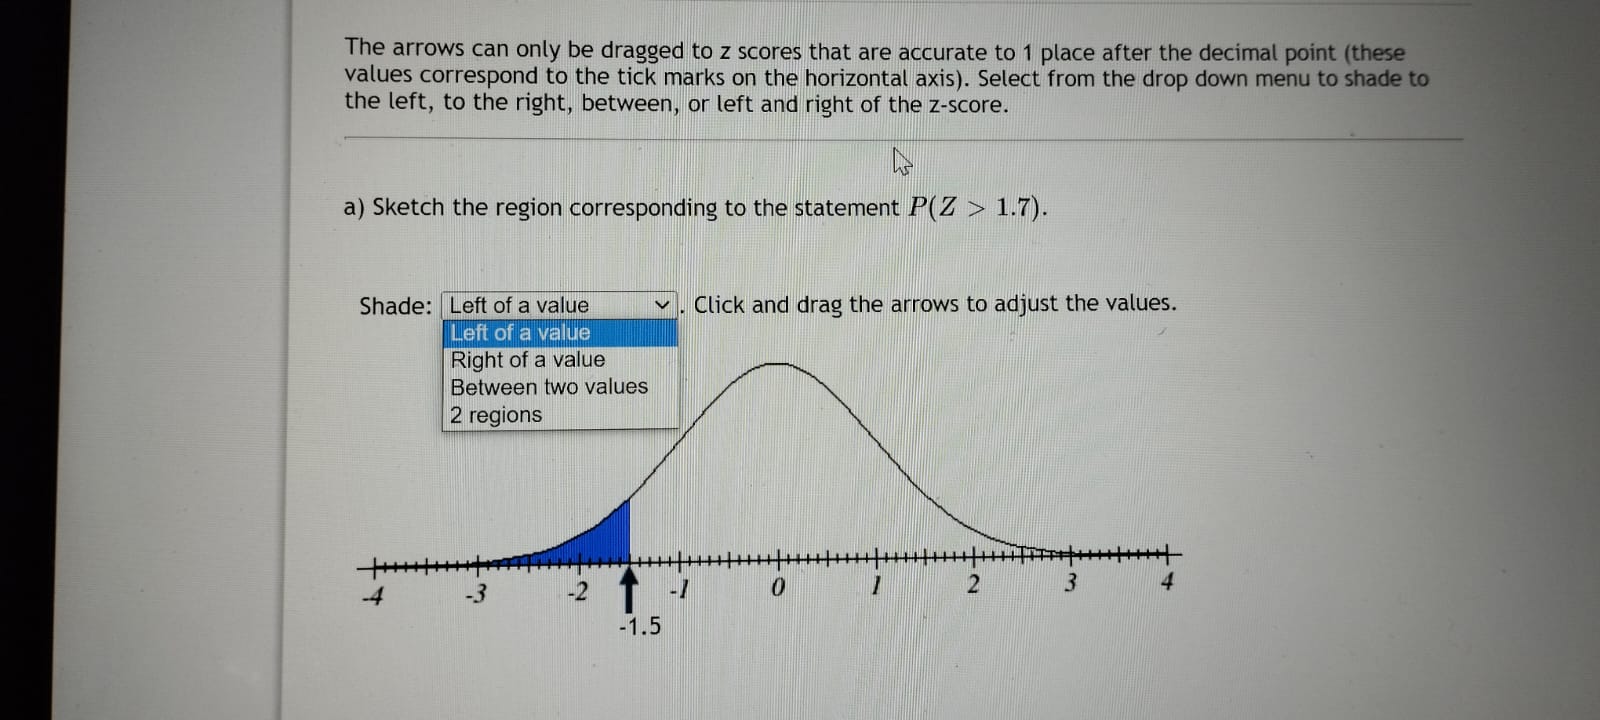
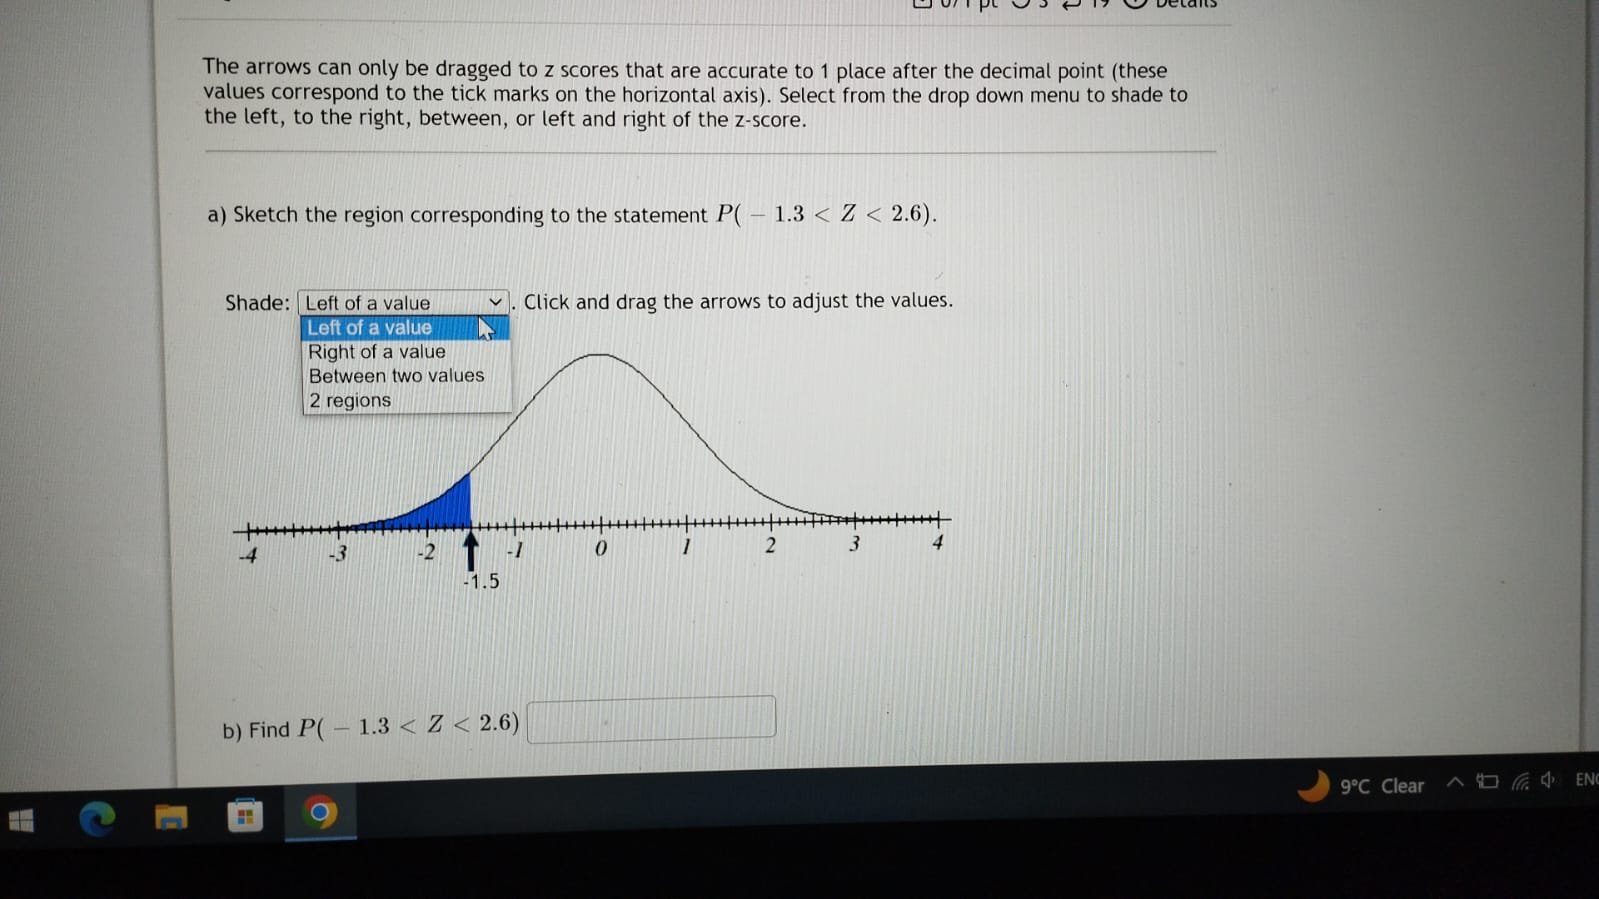
Sketch the region corresponding to the statement P(z > 1.3) Shade: Left of a value V Click and drag the arrows to adjust the values. Left of a value Right of a value Between two values 2 regions 4 -3 -2 -1 2 3 -1.5The arrows can only be dragged to z scores that are accurate to 1 place after the decimal point (these values correspond to the tick marks on the horizontal axis). Select from the drop down menu to shade to the left, to the right, between, or left and right of the z-score. a) Sketch the region corresponding to the statement P(Z 1.7). Shade: Left of a value v Click and drag the arrows to adjust the values. Left of a value Right of a value Between two values 2 regions -4 -2 0 3 -1.5The arrows can only be dragged to z scores that are accurate to 1 place after the decimal point (these values correspond to the tick marks on the horizontal axis). Select from the drop down menu to shade to the left, to the right, between, or left and right of the z-score. a) Sketch the region corresponding to the statement P( - 1.3
Step by Step Solution
There are 3 Steps involved in it

Get step-by-step solutions from verified subject matter experts