

Question: Sketch the sampling distribution and show the area corresponding to the P-vaiue. [Select the correct graph.) CHOICE A CHOICE B CHOICE C (d) Based on
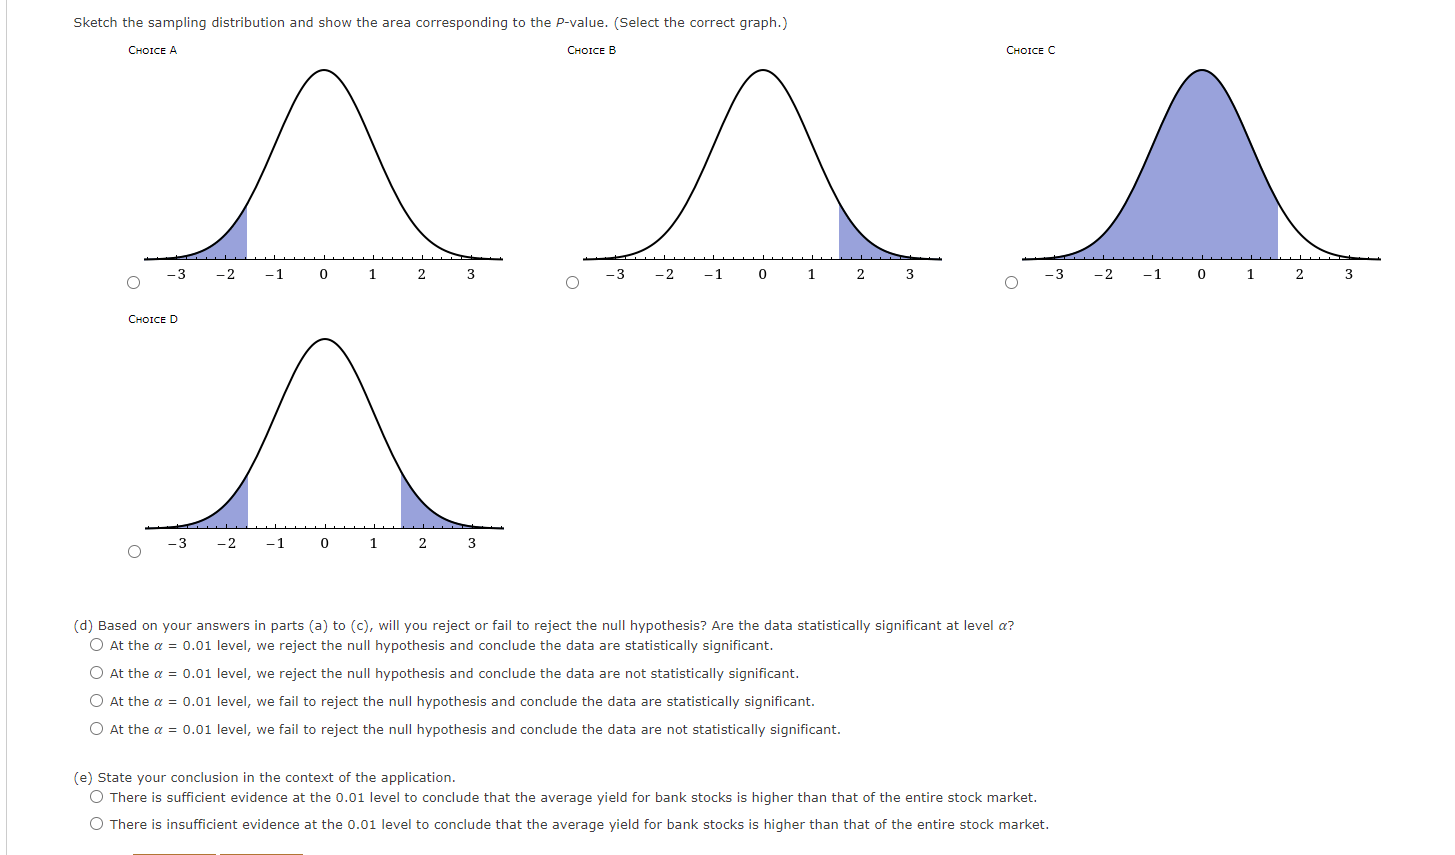
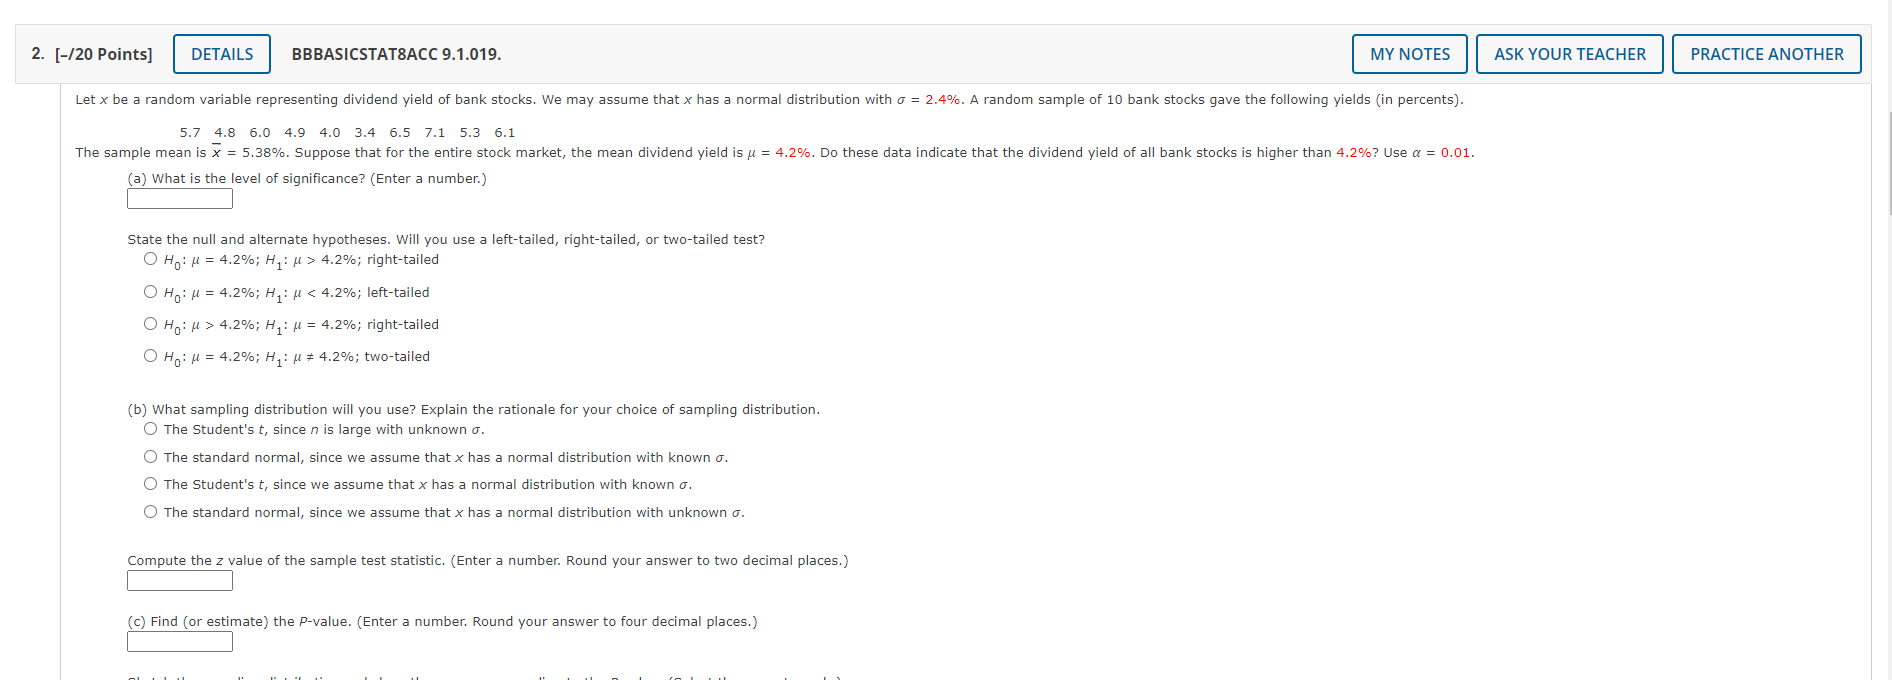
Sketch the sampling distribution and show the area corresponding to the P-vaiue. [Select the correct graph.) CHOICE A CHOICE B CHOICE C (d) Based on your answers in parts (a) to (c), will you reject or fail to reject the null hypothesis? Are the data statistically signicant at level a? C) At the a = 0.01 level, we reject the null hypothesis and conclude the data are statistically signicant. 0 At the at : 0.01 level, we reject the null hypothesis and conclude the data are not statistically signicant. 0 At the a = 0.01 level, we fail to reject the nuli hypothesis and conclude the data are statistically signlcant. 0 At the at : 0.01 level, we fail to reject the nuli hypothesis and conclude the data are not statistically signicant. (e) State your conclusion in the context of the application. 0 There is sufcient evidence at the 0.01 ievel to conclude that the average yield for bank stocks is higher than that of the entire stock market. 0 There is insufcient evidence at the 0.01 level to conclude that the average yield for bank stocks is higher than that of the entire stock market. 2. [-/20 Points] DETAILS BBBASICSTAT8ACC 9.1.019. MY NOTES ASK YOUR TEACHER PRACTICE ANOTHER Let x be a random variable representing dividend yield of bank stocks. We may assume that x has a normal distribution with o = 2.4%. A random sample of 10 bank stocks gave the following yields (in percents). 5.7 4.8 6.0 4.9 4.0 3.4 6.5 7.1 5.3 6.1 The sample mean is x = 5.38%. Suppose that for the entire stock market, the mean dividend yield is u = 4.2%. Do these data indicate that the dividend yield of all bank stocks is higher than 4.2%? Use a = 0.01. (a) What is the level of significance? (Enter a number.) State the null and alternate hypotheses. Will you use a left-tailed, right-tailed, or two-tailed test? O Ho: u = 4.2%; H: H > 4.2%; right-tailed O Ho: M = 4.2%; H1: M 4.2%; H1: M = 4.2%; right-tailed O Ho: M = 4.2%; H1: M # 4.2%; two-tailed (b) What sampling distribution will you use? Explain the rationale for your choice of sampling distribution. The Student's t, since n is large with unknown o. The standard normal, since we assume that x has a normal distribution with known o. The Student's t, since we assume that x has a normal distribution with known o. The standard normal, since we assume that x has a normal distribution with unknown o. Compute the z value of the sample test statistic. (Enter a number. Round your answer to two decimal places.) (c) Find (or estimate) the P-value. (Enter a number. Round your answer to four decimal places.)
Step by Step Solution
There are 3 Steps involved in it

Get step-by-step solutions from verified subject matter experts