

Question: slope and its uncertainty (toward the motion sensor): 1.178 +/- 0.02503 (m/s2) slope and its uncertainty (away from the motion sensor): ? slope and its
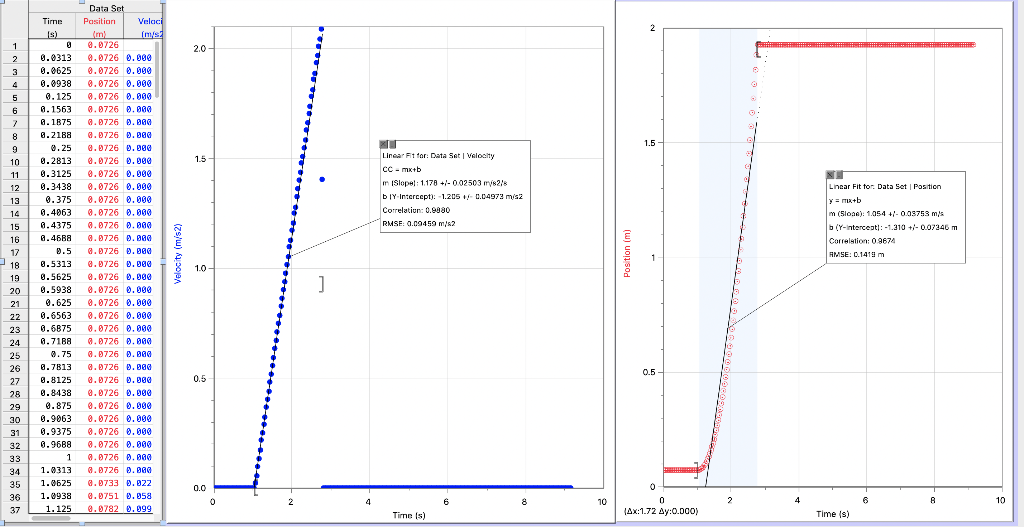
slope and its uncertainty (toward the motion sensor): 1.178 +/- 0.02503 (m/s2)
slope and its uncertainty (away from the motion sensor): ?
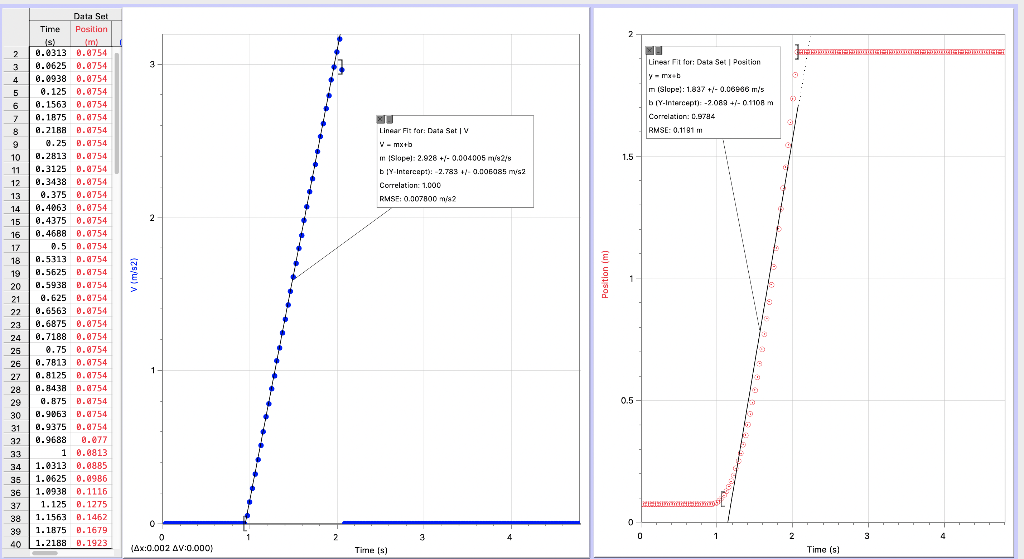
slope and its uncertainty (toward the motion sensor): 2.928 +/-0.006085 (m/s2)
slope and its uncertainty (away from the motion sensor): ?
Calculate the average acceleration.
Calculate the mean value and the error for g using the mean value and error for aave.
Calculate the discrepancy between theoretical and experimental values of g:
Please help I am so confused
2 1 2 2.0 4 5 6 7 8 9 1.5 1.5 10 11 12 13 14 15 Lineart tor: Data Set Velocity CC - mkub i Slopel: 1178 +/-002503 216 DIY Intercept): 1.205 +/- 0.04972 misz Correlation: 0.0080 RMSE 0.09459 m/s2 NE Linear Fit to Data Set Position y = mix+b 16 17 Data Set Tirne Position Velaci IS) {m} Ims? 9 9 8.0726 0.0313 0.0726 0.000 0.0625 0.0726 0.000 0.0938 0.0726 0.000 9. 125 2.0726 0.000 0.1563 0.0726 . 080 8.1675 0.0726 D. 280 8.2188 6.0726 5.000 0.25 6.0726 0.000 0.2813 8.0726 0.000 0.3125 8.0726.000 9.3438 0.0726 0.000 0.375 0.0726 0.000 0.4063 0.0726 0.000 0.4375 0.0726 . 000 8.46BA 6.0726 . 080 3.5 0.726 D. 280 8.5313 0.0726 0.080 0.5625 8.0726 0.000 9.5938 0.0726 0.000 9.625 0.0726 0.000 0.6563 0.0726 6.000 0.5875 8.0725 0.000 0.71BA 0.0726 0.000 6.75 @.726 . 8.7813 @.726 D. De 0.8125 @.726 5.000 9.8438 8.0726 0.000 0.875 0.0726 0.000 0.9063 0.0726 0.000 0.9375 0.0726 0.000 0.96B8 0.0726 0.989 1 0.0726 0.800 1.9313 6. 9726 0.00 1.0525 6.0733 D. B2Z 1.093E 0.0751 0.058 1.125 0.0782 0.099 m (502): 1.054 +/- 0.08753 m/s bl-intercepti: -1.310 +-0.07246 m Correlation: 09674 AMSE: 0.1419 m Velocity (m/s2) Position (m) 1.0 ] 0.5 0.5 18 19 20 21 22 23 24 25 26 27 28 29 30 31 32 33 34 35 36 37 0.0 2 4 10 2 4 0 (AX:1.72 Ay:0.000) 8 10 Tirnn (s) Time (s) Data Set Position Time 2 DEDAH Lirear for Data Set Ppeitian m (Slupel: 1.827 +/- 0.06886 m's DIY-Intercept): -2.082 +/- 01108 Correlation: 0.9794 RMSE: 0.1181 1.5 Linear Fit for: Data Set IV V-mx+b m Slopel: 2.928 +/- 0.00400528 by Intercept): 2.788 +/- 0.005085 m/s2 Correlation: 1.000 RMSE: 0.007800 M/? 2 V {m/s2) Position (m) 2 0.313 0.6754 3 0.0625 0.8754 4 0.0938 0.0754 5 0.125 0.0754 6 0.1563 0.6754 7 0.1875 2.8754 8 8.21B8 9.6754 9 0.25 0.6754 10 8.2813 0.6754 11 0.3125 0.0254 12 0.3438 0.8754 13 9.375 0.9754 14 0.4063 0.0754 15 0.4375 0.9754 16 0.4688 0.6754 17 7.5 9.6754 18 0.5313 0.6754 19 8.5625 D.6754 20 0.5938 9.6754 21 0.625 0.0254 22 0.6563 0.0754 23 0.6875 0.9754 24 0.7188 0.0754 25 0.75 0.6754 26 0.7813 8.8754 27 0.8125 B.6754 28 6.8438 0.6754 29 6.875 0.6754 30 8.9053 0.6754 31 0.9375 0.8754 32 9.9688 0.277 33 1 0.0813 34 1.0313 0.6885 35 1.0625 0.0986 36 1.9938 0.1116 37 1.125 0.1275 38 1.1563 0.1462 39 1.1875 0.1679 40 | 1.2188 B. 1923 1 0.5 WHI 0 0 2 4 1 2 3 4 0 AX:0.002 AV:0.000) Time (s) Time (s) 2 1 2 2.0 4 5 6 7 8 9 1.5 1.5 10 11 12 13 14 15 Lineart tor: Data Set Velocity CC - mkub i Slopel: 1178 +/-002503 216 DIY Intercept): 1.205 +/- 0.04972 misz Correlation: 0.0080 RMSE 0.09459 m/s2 NE Linear Fit to Data Set Position y = mix+b 16 17 Data Set Tirne Position Velaci IS) {m} Ims? 9 9 8.0726 0.0313 0.0726 0.000 0.0625 0.0726 0.000 0.0938 0.0726 0.000 9. 125 2.0726 0.000 0.1563 0.0726 . 080 8.1675 0.0726 D. 280 8.2188 6.0726 5.000 0.25 6.0726 0.000 0.2813 8.0726 0.000 0.3125 8.0726.000 9.3438 0.0726 0.000 0.375 0.0726 0.000 0.4063 0.0726 0.000 0.4375 0.0726 . 000 8.46BA 6.0726 . 080 3.5 0.726 D. 280 8.5313 0.0726 0.080 0.5625 8.0726 0.000 9.5938 0.0726 0.000 9.625 0.0726 0.000 0.6563 0.0726 6.000 0.5875 8.0725 0.000 0.71BA 0.0726 0.000 6.75 @.726 . 8.7813 @.726 D. De 0.8125 @.726 5.000 9.8438 8.0726 0.000 0.875 0.0726 0.000 0.9063 0.0726 0.000 0.9375 0.0726 0.000 0.96B8 0.0726 0.989 1 0.0726 0.800 1.9313 6. 9726 0.00 1.0525 6.0733 D. B2Z 1.093E 0.0751 0.058 1.125 0.0782 0.099 m (502): 1.054 +/- 0.08753 m/s bl-intercepti: -1.310 +-0.07246 m Correlation: 09674 AMSE: 0.1419 m Velocity (m/s2) Position (m) 1.0 ] 0.5 0.5 18 19 20 21 22 23 24 25 26 27 28 29 30 31 32 33 34 35 36 37 0.0 2 4 10 2 4 0 (AX:1.72 Ay:0.000) 8 10 Tirnn (s) Time (s) Data Set Position Time 2 DEDAH Lirear for Data Set Ppeitian m (Slupel: 1.827 +/- 0.06886 m's DIY-Intercept): -2.082 +/- 01108 Correlation: 0.9794 RMSE: 0.1181 1.5 Linear Fit for: Data Set IV V-mx+b m Slopel: 2.928 +/- 0.00400528 by Intercept): 2.788 +/- 0.005085 m/s2 Correlation: 1.000 RMSE: 0.007800 M/? 2 V {m/s2) Position (m) 2 0.313 0.6754 3 0.0625 0.8754 4 0.0938 0.0754 5 0.125 0.0754 6 0.1563 0.6754 7 0.1875 2.8754 8 8.21B8 9.6754 9 0.25 0.6754 10 8.2813 0.6754 11 0.3125 0.0254 12 0.3438 0.8754 13 9.375 0.9754 14 0.4063 0.0754 15 0.4375 0.9754 16 0.4688 0.6754 17 7.5 9.6754 18 0.5313 0.6754 19 8.5625 D.6754 20 0.5938 9.6754 21 0.625 0.0254 22 0.6563 0.0754 23 0.6875 0.9754 24 0.7188 0.0754 25 0.75 0.6754 26 0.7813 8.8754 27 0.8125 B.6754 28 6.8438 0.6754 29 6.875 0.6754 30 8.9053 0.6754 31 0.9375 0.8754 32 9.9688 0.277 33 1 0.0813 34 1.0313 0.6885 35 1.0625 0.0986 36 1.9938 0.1116 37 1.125 0.1275 38 1.1563 0.1462 39 1.1875 0.1679 40 | 1.2188 B. 1923 1 0.5 WHI 0 0 2 4 1 2 3 4 0 AX:0.002 AV:0.000) Time (s) Time (s)
Step by Step Solution
There are 3 Steps involved in it

Get step-by-step solutions from verified subject matter experts