

Question: So for this question we are using C program and we are graphing it through Gnuplot: Draw a graph of sin(x^3) for - p 2.0
So for this question we are using C program and we are graphing it through Gnuplot:
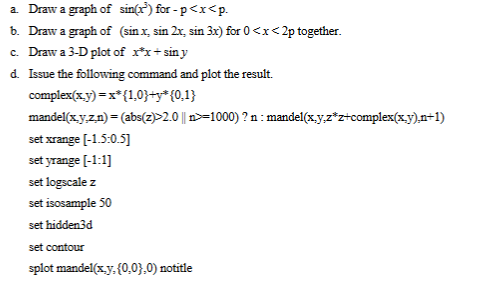
Draw a graph of sin(x^3) for - p 2.0 || n > = 1000) ? n: mandel(x, y, z * z + complex(x, y), n + 1) set xrange [-1.5: 0.5] set yrange [-1: 1] set logscale z set isosample 50 set hidden3d set contour splot mandel(x, y, {0, 0}, 0) notitle
Step by Step Solution
There are 3 Steps involved in it
1 Expert Approved Answer
Step: 1 Unlock

Question Has Been Solved by an Expert!
Get step-by-step solutions from verified subject matter experts
Step: 2 Unlock
Step: 3 Unlock