

Question: So I am stuck. We have a graph here that is studying air quality index and biomass percent cover. Attached is a scatter-plot graph and
So I am stuck. We have a graph here that is studying air quality index and biomass percent cover. Attached is a scatter-plot graph and the follow up question for the graph.
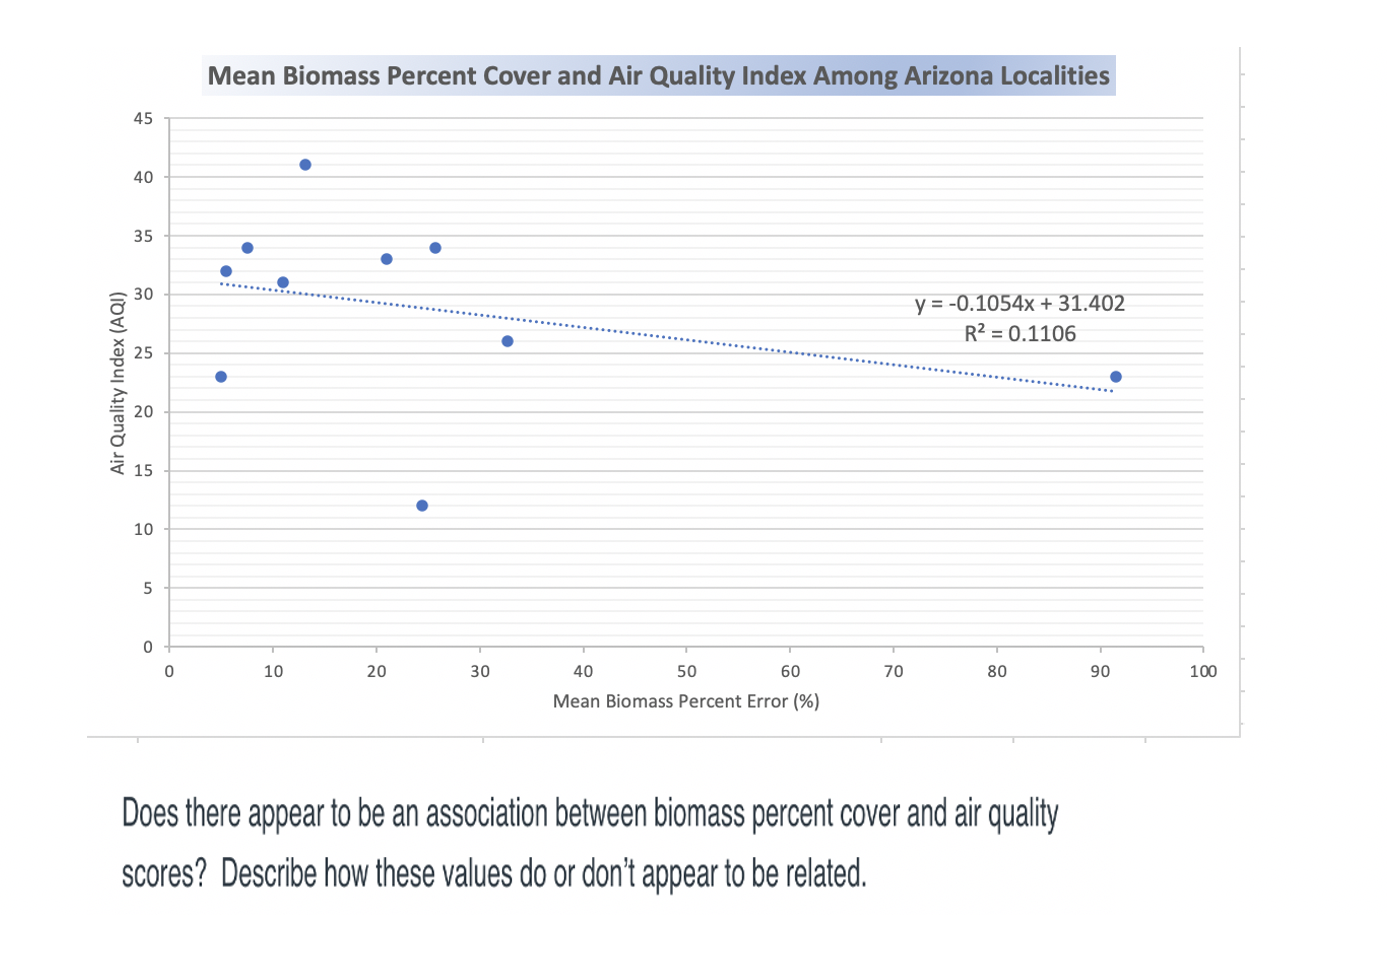
Mean Biomass Percent ;"._ . . I\" O y = -O.1'04x + 31402 R2 = 0.1106 M U! 0 ...... Air Quaiitv Index (Am) N O H U1 10 4o 50 60 Mean Biomass Percent Error ('56) Does there appear to be an association between biomass percent cover and air quality scores? Describe how these values do or don't appear to be related
Step by Step Solution
There are 3 Steps involved in it
1 Expert Approved Answer
Step: 1 Unlock

Question Has Been Solved by an Expert!
Get step-by-step solutions from verified subject matter experts
Step: 2 Unlock
Step: 3 Unlock