Question: S&O Plan: Level Production Plan Plan Totals Dec Jan Feb Mar Apr May Jun Jul Aug Sep Oct Nov Dec Jan Sales Forecast revenue units
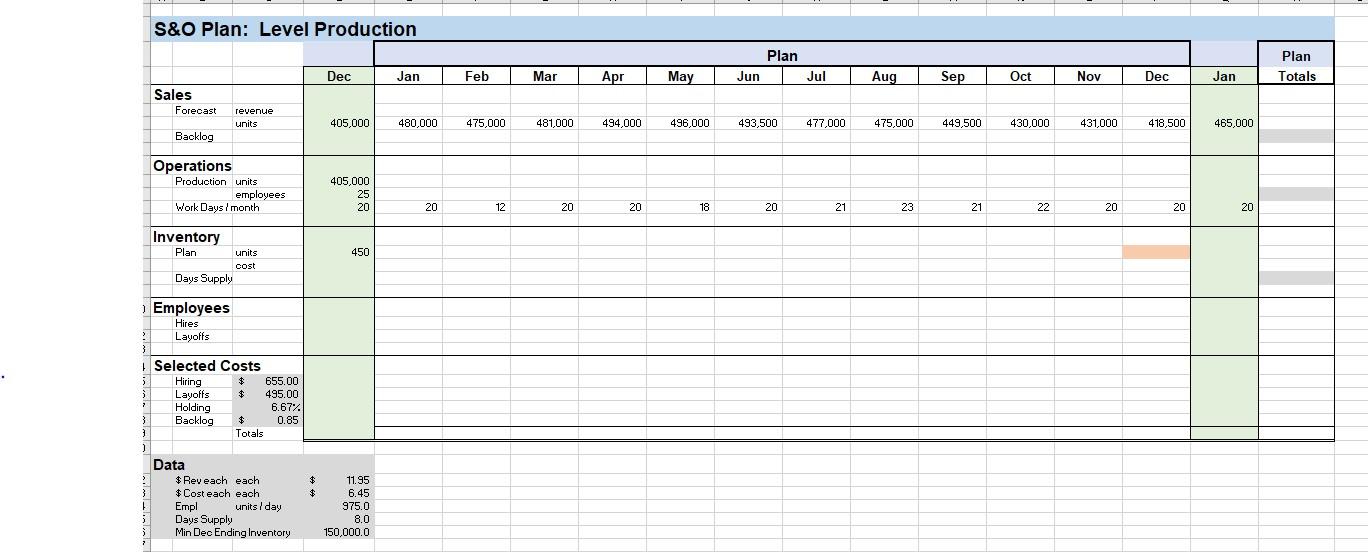
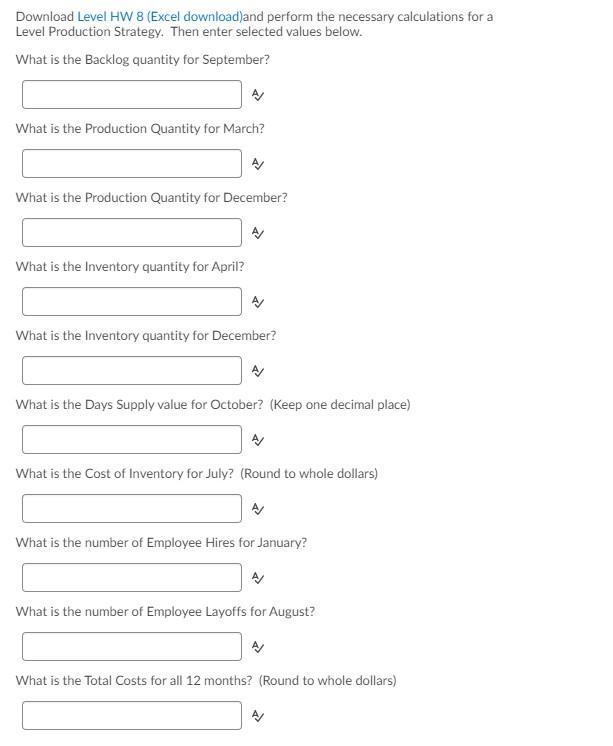
S&O Plan: Level Production Plan Plan Totals Dec Jan Feb Mar Apr May Jun Jul Aug Sep Oct Nov Dec Jan Sales Forecast revenue units 405,000 480,000 475,000 481,000 494,000 496,000 493,500 477,000 475,000 449,500 430,000 430,000 431,000 418.500 418,500 465,000 Backlog Operations Production units employees Work Days / month 405,000 25 20 20 12 20 20 18 20 21 23 21 22 20 20 20 450 Inventory Plan units cost Days Supply Employees Hires ? Layoffs 3 3 Selected Costs Hiring $ 655.00 Layoffs $ 495.00 Holding 6.67% Backlog $ 0.85 Totals 7 3 3 ) $ $ 3 | Data $Rev each each $Cost each each Empl units / day Days Supply Min Dec Ending Inventory 11.95 6.45 975.0 8.0 150,000.0 Download Level HW 8 (Excel download)and perform the necessary calculations for a Level Production Strategy. Then enter selected values below. What is the Backlog quantity for September? What is the Production Quantity for March? What is the Production Quantity for December? What is the Inventory quantity for April? What is the Inventory quantity for December? What is the Days Supply value for October? (Keep one decimal place) What is the Cost of Inventory for July? (Round to whole dollars) What is the number of Employee Hires for January? What is the number of Employee Layoffs for August? What is the Total Costs for all 12 months? (Round to whole dollars) S&O Plan: Level Production Plan Plan Totals Dec Jan Feb Mar Apr May Jun Jul Aug Sep Oct Nov Dec Jan Sales Forecast revenue units 405,000 480,000 475,000 481,000 494,000 496,000 493,500 477,000 475,000 449,500 430,000 430,000 431,000 418.500 418,500 465,000 Backlog Operations Production units employees Work Days / month 405,000 25 20 20 12 20 20 18 20 21 23 21 22 20 20 20 450 Inventory Plan units cost Days Supply Employees Hires ? Layoffs 3 3 Selected Costs Hiring $ 655.00 Layoffs $ 495.00 Holding 6.67% Backlog $ 0.85 Totals 7 3 3 ) $ $ 3 | Data $Rev each each $Cost each each Empl units / day Days Supply Min Dec Ending Inventory 11.95 6.45 975.0 8.0 150,000.0 Download Level HW 8 (Excel download)and perform the necessary calculations for a Level Production Strategy. Then enter selected values below. What is the Backlog quantity for September? What is the Production Quantity for March? What is the Production Quantity for December? What is the Inventory quantity for April? What is the Inventory quantity for December? What is the Days Supply value for October? (Keep one decimal place) What is the Cost of Inventory for July? (Round to whole dollars) What is the number of Employee Hires for January? What is the number of Employee Layoffs for August? What is the Total Costs for all 12 months? (Round to whole dollars)


