Question: so the categorical varaible will be the trimester prenatal care while births 1999 will be the quantitative varaiable. Communit Community Area Name Trimester Prenatal Carth
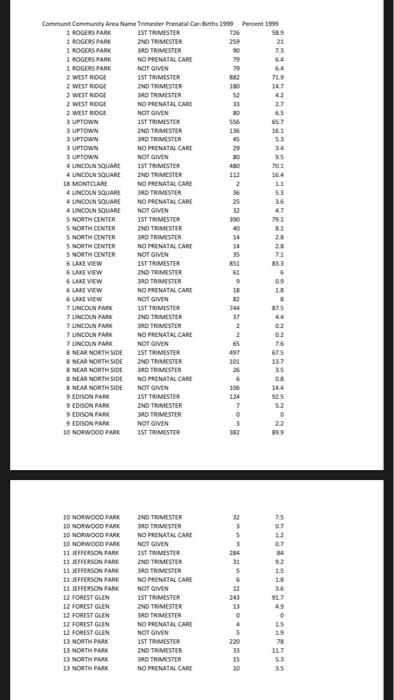
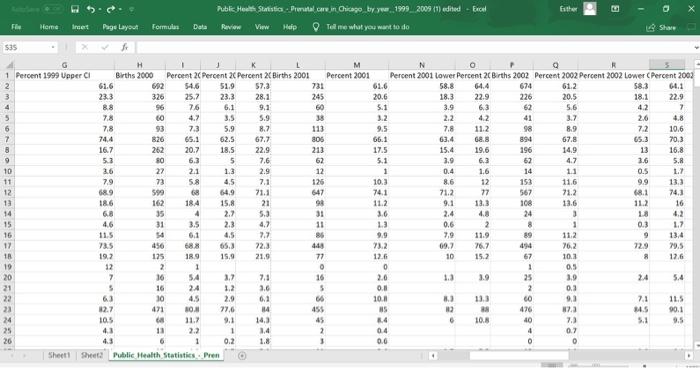
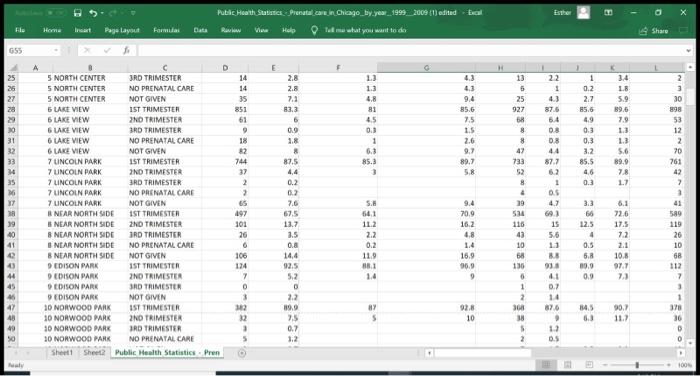
so the categorical varaible will be the trimester prenatal care while births 1999 will be the quantitative varaiable.
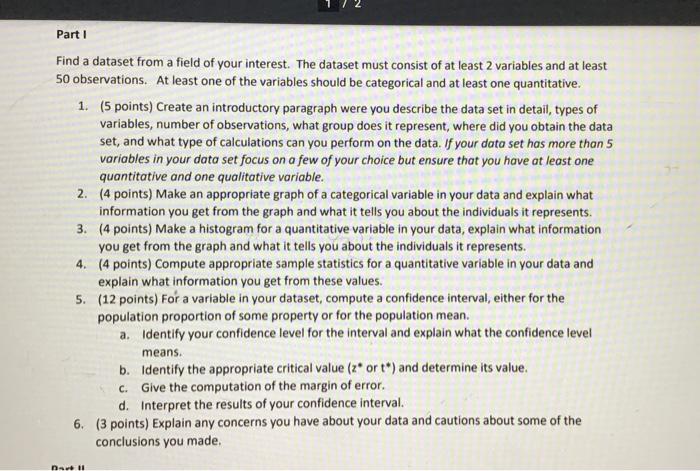
Communit Community Area Name Trimester Prenatal Carth 1999 Percent 1999 1 ROGERS PARK 1ST TRIMESTER 583 1 ROGERS PARK 2ND TRIMESTER 259 21 1 ROGERS PARK 3RD TRIMESTER 73 1 ROGERS PARK NO PRENATAL CARE 64 1 ROGERS PARK NOT GIVEN 2 WEST RIDGE 1ST TRIMESTER 729 2 WEST RIDGE 2ND TRIMESTER 347 2 WEST RIDGE 3RD TRIMESTER 42 2 WEST RIDGE NO PRENATAL CARE 13 27 2 WEST RIDGE NOT GIVEN 30 65 UPTOWN 1ST TRIMESTER 556 3 UPTOWN 2ND TRIMESTER 135 161 3 UPTOWN 3RD TRIMESTER 53 UPTOWN NO PRENATAL CARE 3 UPTOWN NOT GIVEN * LINCOLN SQUARE 1ST TRIMESTER 4 LINCOLN SQUARE 2ND TRIMESTER IB MONTCLARE NO PRENATAL CARE 2 4 LINCOLN SQUARE 3RD TRIMESTER 36 53 LINCOLN SQUARE NO PRENATAL CARE 36 4 LINCOLN SQUARE NOT GIVEN 32 S NORTH CENTER 1ST TRIMESTER 390 79 5 NORTH CENTER 2ND TRIMESTER 4 5 NORTH CENTER 3RD TRIMESTER 34 NORTH CENTER NO PRENATAL CARE 5 NORTH CENTER NOT GIVEN 35 6 LAKEVIEW 1ST TRIMESTER 351 8333 6 LAKEVIEW 2ND TRIMESTER 61 LAKEVIEW 3D TRIMESTER LAKEVIEW NO PRENATAL CARE 18 6 LAKEVIEW NOT GIVEN 32 7 UNCON PARK 15 TRIMESTER 14 7 LINCOLN PARK 2ND TRIMESTER ** 7 LINCOLN PARK 3RD TRIMESTER 2 7 LINCOLN PARK NO PRENATAL CARE 2 LINCOLN PARK NOT GIVEN 65 8 NEAR NORTH SIDE 1ST TRIMESTER 497 675 8 NEAR NORTH SIDE 2ND TRIMESTER 101 NEAR NORTHSIDE RD TRIMESTER 25 NEAR NORTHSIDE NO PRENATAL CARE 6 8 NEAR NORTHSIDE NOT GIVEN 206 9 EDISON PARK 1ST TRIMESTER 124 9 EDISON PARK 2ND TRIMESTER 7 52 9 EDISON PARK 3RD TRIMESTER 9 EDISON PARK NOT GIVEN 3 22 10 NORWOOD PARK 1ST TRIMESTER 89.9 0. 3 254 15 12 30 NORWOOD PARK 2ND TRIMESTER 10 NORWOOD PARK RD TRIMESTER DO NORWOOD PARK NO PRENATAL CARE 10 NORWOOD PARE NOT GIVEN 11. PERSON PARK 1ST TRIMESTER 11 JEFFERSON PARK ND TRIMESTER 11 JEFFERSON PARK 3RD TRIMESTER 11 JEFFERSON PARK NO PRENATAL CARE 11 JEFFERSON PARK NOT GIVEN 12 FOREST GLEN 1ST TRIMESTER 12 FOREST GLEN 2ND TRIMESTER 12 FOREST GLEN 3RD TRIMESTER 12 FOREST GLEN NO PRENATAL CARE 12 FOREST GLENNOT GIVEN 13 NORTH PARK IST TRIMESTER 13 NORTH PARK 2ND TRIMESTER 13 NORTH PARK 3RD TRIMESTER 13 NORTH PARK NO PRENATAL CARE 13 atteet . 5 220 33 15 10 78 117 53 35 Part 1 Find a dataset from a field of your interest. The dataset must consist of at least 2 variables and at least 50 observations. At least one of the variables should be categorical and at least one quantitative. 1. (5 points) Create an introductory paragraph were you describe the data set in detail, types of variables, number of observations, what group does it represent, where did you obtain the data set, and what type of calculations can you perform on the data. If your data set has more than 5 variables in your data set focus on a few of your choice but ensure that you have at least one quantitative and one qualitative variable. 2. (4 points) Make an appropriate graph of a categorical variable in your data and explain what information you get from the graph and what it tells you about the individuals it represents. 3. (4 points) Make a histogram for a quantitative variable in your data, explain what information you get from the graph and what it tells you about the individuals it represents. 4. (4 points) Compute appropriate sample statistics for a quantitative variable in your data and explain what information you get from these values. 5. (12 points) For a variable in your dataset, compute a confidence interval, either for the population proportion of some property or for the population mean. a. Identify your confidence level for the interval and explain what the confidence level means. b. Identify the appropriate critical value (z* or t*) and determine its value. c. Give the computation of the margin of error. d. Interpret the results of your confidence interval. 6. (3 points) Explain any concerns you have about your data and cautions about some of the conclusions you made. navel Public Heat Statistics Pratalcore in Chicago by yw 1999_2009 1) edited - Excel Home Incert Page Layout Formulas Data Vww Help To me what you want to do Share $35 233 23.3 28.1 20.6 226 54.9 712 M R 1 Percent 1999 Upper CI Births 2000 Percent 2(Percent 2C Percent Births 2001 Percent 2001 Percent 2001 Lower Percent 2CBirths 2002 Percent 2002 Percent 2002 Lower Percent 2003 2 61.6 692 54.6 51.9 57.3 731 61.6 58.8 64.4 674 61.2 58.3 64.1 326 25.7 245 18.3 22.9 4 20.5 18.1 8.8 22.9 96 76 6.1 9,1 60 5.1 3.9 6.3 62 5.6 4.2 5 7 7.8 60 4,7 3.5 5.9 38 3.2 2.2 41 3.7 6 7.8 93 2.6 7.3 4.8 5.9 8.7 113 9.5 7.8 11.2 98 8.9 10.6 7 74,4 826 7.2 65.1 62.5 67.7 805 66.1 63.4 68.8 894 67.8 65.3 8 70.3 16.7 262 20.7 18.5 22.9 213 17.5 15.4 19.6 196 14.9 16.8 13 9 5.3 80 6.3 5 7.6 62 5.1 3.9 6.3 62 4.7 10 2.6 3.6 5.R 22 2.1 1.3 2.9 12 1 0.4 1.6 14 11 0.5 11 1.7 7.9 73 5.8 4,5 7.1 126 10.3 8.6 12 153 11.6 9.9 13.3 12 689 599 647 74.1 77 567 13 71.2 68.1 74.3 186 162 18.4 15.8 21 93 11.2 9.1 13.3 108 13.6 112 14 16 6.8 35 2.7 3.6 2.4 4.8 24 3 1.8 4,2 15 4.6 31 2.3 4.7 11 1.3 0.6 2 8 0.3 16 1 11.5 54 1.7 4.5 7.7 86 9.9 7,9 11.9 89 11.2 9 13.4 17 456 688 65.3 72.3 4:48 73:2 494 1 76,2 29.5 19.2 729 125 18.9 15,9 21.9 77 12.6 10 15.2 67 10.3 12.6 19 12 2 1 0 0 1 0.5 20 7 16 SA 1.7 7.1 16 2.0 1.3 3.9 25 1.9 21 5.4 5 16 2.4 1.2 3.6 5 0. 2 0.3 22 63 10 4.5 2.9 6,1 66 100 3 133 60 9.3 11.5 23 12.7 7.1 471 10. 114 455 88 476 2.3 34.5 90.1 24 10.5 112 9.1 14,3 45 8.4 6 10.6 40 7. 5.1 25 9.5 4.3 18 2.2 1 3.4 2 04 4 0.7 26 6 1 0.2 1.8 3 0.0 O 0 Sheet1 Sheet Public Health Statistics Pren 26.& 73.5 774 Eral Public Health Suites Precata come in Chicago_by_year_1995_2009 (1) edited Help Tell me what you want to do Page Layout Formular Data Share 655 A E H 4.3 25 26 27 28 29 30 31 32 33 14 14 35 851 61 2.8 2.8 7.1 83.3 6 0.9 1.3 4,8 81 4.5 0.3 1 6.3 85.3 3 9.4 85.6 7.5 1.5 2.6 9.7 89.7 5.8 13 5 25 927 68 8 8 47 733 22 1 43 87.6 6.4 0.8 0.3 44 877 1 0.2 2.7 85.6 4.9 0.3 0.3 3.2 85.5 4.6 0.3 3.4 LB 5.9 89.5 7.9 1.3 1.3 5.6 89.9 7.8 1.7 8 87.5 8 1 35 M6 37 38 19 40 41 5.B D 5 NORTH CENTER 3RD TRIMESTER 5 NORTH CENTER NO PRENATAL CARE 5 NORTH CENTER NOT GIVEN 5 LAKE VIEW IST TRIMESTER 6 LAKE VIEW NO TRIMESTER 6 LAKEVIEW 3RD TRIMESTER 6 LAKE VIEW NO PRENATAL CARE 6 LAKE VIEW NOT GIVEN 7 UNCOLN PARK IST TRIMESTER 7 UNCOLN PARK 2ND TRIMESTER 7 LINCOLN PARK 3RD TRIMESTER 7 UNCOLN PARK NO PRENATAL CARE 7 UNCOLN PARK NOT GIVEN NEAR NORTH SIDE 1ST TRIMESTER NEAR NORTH SIDE 2ND TRIMESTER NEAR NORTH SIDE 3RD TRIMESTER NEAR NORTH SIDE NO PRENATAL CARE B NEAR NORTH SIDE NOT GIVEN EDISON PARK 1ST TRIMESTER 9 EDISON PARK 2ND TRIMESTER EDISON PARK 3RD TRIMESTER EDISON PARK NOT GIVEN 10 NORWOOD PARK IST TUMESTER 10 NORWOOD PARK 2ND TRIMESTER 30 NORWOOD PARK 3RD TRIMESTER 30 NORWOOD PARK NO PRENATAL CARE Sheeft Sheet2 Public Health Statistics Pren 18 82 744 37 2 2 65 197 101 26 6.1 72.6 4.7 691 15 5.6 11 175 9.4 70.9 16.2 4,8 1.4 15.9 90.9 9 0.2 0.2 7.6 67.5 13.7 3.5 0.8 14,4 92.5 5.2 0 2.2 89.9 7.5 0.7 1.2 11.2 2.2 0.2 11.9 3.1 1.4 2 3 30 898 53 12 2 70 761 42 7 3 41 589 119 26 10 68 112 7 3 1 378 36 D D 7.2 2.1 10.8 39 524 116 43 10 68 136 0 1 2 368 38 $ 2 3.3 66 12.5 4 0.5 6.8 19.0 0.9 ec.Sc. 106 124 7 0 3 2 32 3 5 9. 7.) 44 45 46 42 40 49 50 41 0.7 14 876 7 92.8 10 34,5 6.3 90.2 117 1.2 05 Communit Community Area Name Trimester Prenatal Carth 1999 Percent 1999 1 ROGERS PARK 1ST TRIMESTER 583 1 ROGERS PARK 2ND TRIMESTER 259 21 1 ROGERS PARK 3RD TRIMESTER 73 1 ROGERS PARK NO PRENATAL CARE 64 1 ROGERS PARK NOT GIVEN 2 WEST RIDGE 1ST TRIMESTER 729 2 WEST RIDGE 2ND TRIMESTER 347 2 WEST RIDGE 3RD TRIMESTER 42 2 WEST RIDGE NO PRENATAL CARE 13 27 2 WEST RIDGE NOT GIVEN 30 65 UPTOWN 1ST TRIMESTER 556 3 UPTOWN 2ND TRIMESTER 135 161 3 UPTOWN 3RD TRIMESTER 53 UPTOWN NO PRENATAL CARE 3 UPTOWN NOT GIVEN * LINCOLN SQUARE 1ST TRIMESTER 4 LINCOLN SQUARE 2ND TRIMESTER IB MONTCLARE NO PRENATAL CARE 2 4 LINCOLN SQUARE 3RD TRIMESTER 36 53 LINCOLN SQUARE NO PRENATAL CARE 36 4 LINCOLN SQUARE NOT GIVEN 32 S NORTH CENTER 1ST TRIMESTER 390 79 5 NORTH CENTER 2ND TRIMESTER 4 5 NORTH CENTER 3RD TRIMESTER 34 NORTH CENTER NO PRENATAL CARE 5 NORTH CENTER NOT GIVEN 35 6 LAKEVIEW 1ST TRIMESTER 351 8333 6 LAKEVIEW 2ND TRIMESTER 61 LAKEVIEW 3D TRIMESTER LAKEVIEW NO PRENATAL CARE 18 6 LAKEVIEW NOT GIVEN 32 7 UNCON PARK 15 TRIMESTER 14 7 LINCOLN PARK 2ND TRIMESTER ** 7 LINCOLN PARK 3RD TRIMESTER 2 7 LINCOLN PARK NO PRENATAL CARE 2 LINCOLN PARK NOT GIVEN 65 8 NEAR NORTH SIDE 1ST TRIMESTER 497 675 8 NEAR NORTH SIDE 2ND TRIMESTER 101 NEAR NORTHSIDE RD TRIMESTER 25 NEAR NORTHSIDE NO PRENATAL CARE 6 8 NEAR NORTHSIDE NOT GIVEN 206 9 EDISON PARK 1ST TRIMESTER 124 9 EDISON PARK 2ND TRIMESTER 7 52 9 EDISON PARK 3RD TRIMESTER 9 EDISON PARK NOT GIVEN 3 22 10 NORWOOD PARK 1ST TRIMESTER 89.9 0. 3 254 15 12 30 NORWOOD PARK 2ND TRIMESTER 10 NORWOOD PARK RD TRIMESTER DO NORWOOD PARK NO PRENATAL CARE 10 NORWOOD PARE NOT GIVEN 11. PERSON PARK 1ST TRIMESTER 11 JEFFERSON PARK ND TRIMESTER 11 JEFFERSON PARK 3RD TRIMESTER 11 JEFFERSON PARK NO PRENATAL CARE 11 JEFFERSON PARK NOT GIVEN 12 FOREST GLEN 1ST TRIMESTER 12 FOREST GLEN 2ND TRIMESTER 12 FOREST GLEN 3RD TRIMESTER 12 FOREST GLEN NO PRENATAL CARE 12 FOREST GLENNOT GIVEN 13 NORTH PARK IST TRIMESTER 13 NORTH PARK 2ND TRIMESTER 13 NORTH PARK 3RD TRIMESTER 13 NORTH PARK NO PRENATAL CARE 13 atteet . 5 220 33 15 10 78 117 53 35 Part 1 Find a dataset from a field of your interest. The dataset must consist of at least 2 variables and at least 50 observations. At least one of the variables should be categorical and at least one quantitative. 1. (5 points) Create an introductory paragraph were you describe the data set in detail, types of variables, number of observations, what group does it represent, where did you obtain the data set, and what type of calculations can you perform on the data. If your data set has more than 5 variables in your data set focus on a few of your choice but ensure that you have at least one quantitative and one qualitative variable. 2. (4 points) Make an appropriate graph of a categorical variable in your data and explain what information you get from the graph and what it tells you about the individuals it represents. 3. (4 points) Make a histogram for a quantitative variable in your data, explain what information you get from the graph and what it tells you about the individuals it represents. 4. (4 points) Compute appropriate sample statistics for a quantitative variable in your data and explain what information you get from these values. 5. (12 points) For a variable in your dataset, compute a confidence interval, either for the population proportion of some property or for the population mean. a. Identify your confidence level for the interval and explain what the confidence level means. b. Identify the appropriate critical value (z* or t*) and determine its value. c. Give the computation of the margin of error. d. Interpret the results of your confidence interval. 6. (3 points) Explain any concerns you have about your data and cautions about some of the conclusions you made. navel Public Heat Statistics Pratalcore in Chicago by yw 1999_2009 1) edited - Excel Home Incert Page Layout Formulas Data Vww Help To me what you want to do Share $35 233 23.3 28.1 20.6 226 54.9 712 M R 1 Percent 1999 Upper CI Births 2000 Percent 2(Percent 2C Percent Births 2001 Percent 2001 Percent 2001 Lower Percent 2CBirths 2002 Percent 2002 Percent 2002 Lower Percent 2003 2 61.6 692 54.6 51.9 57.3 731 61.6 58.8 64.4 674 61.2 58.3 64.1 326 25.7 245 18.3 22.9 4 20.5 18.1 8.8 22.9 96 76 6.1 9,1 60 5.1 3.9 6.3 62 5.6 4.2 5 7 7.8 60 4,7 3.5 5.9 38 3.2 2.2 41 3.7 6 7.8 93 2.6 7.3 4.8 5.9 8.7 113 9.5 7.8 11.2 98 8.9 10.6 7 74,4 826 7.2 65.1 62.5 67.7 805 66.1 63.4 68.8 894 67.8 65.3 8 70.3 16.7 262 20.7 18.5 22.9 213 17.5 15.4 19.6 196 14.9 16.8 13 9 5.3 80 6.3 5 7.6 62 5.1 3.9 6.3 62 4.7 10 2.6 3.6 5.R 22 2.1 1.3 2.9 12 1 0.4 1.6 14 11 0.5 11 1.7 7.9 73 5.8 4,5 7.1 126 10.3 8.6 12 153 11.6 9.9 13.3 12 689 599 647 74.1 77 567 13 71.2 68.1 74.3 186 162 18.4 15.8 21 93 11.2 9.1 13.3 108 13.6 112 14 16 6.8 35 2.7 3.6 2.4 4.8 24 3 1.8 4,2 15 4.6 31 2.3 4.7 11 1.3 0.6 2 8 0.3 16 1 11.5 54 1.7 4.5 7.7 86 9.9 7,9 11.9 89 11.2 9 13.4 17 456 688 65.3 72.3 4:48 73:2 494 1 76,2 29.5 19.2 729 125 18.9 15,9 21.9 77 12.6 10 15.2 67 10.3 12.6 19 12 2 1 0 0 1 0.5 20 7 16 SA 1.7 7.1 16 2.0 1.3 3.9 25 1.9 21 5.4 5 16 2.4 1.2 3.6 5 0. 2 0.3 22 63 10 4.5 2.9 6,1 66 100 3 133 60 9.3 11.5 23 12.7 7.1 471 10. 114 455 88 476 2.3 34.5 90.1 24 10.5 112 9.1 14,3 45 8.4 6 10.6 40 7. 5.1 25 9.5 4.3 18 2.2 1 3.4 2 04 4 0.7 26 6 1 0.2 1.8 3 0.0 O 0 Sheet1 Sheet Public Health Statistics Pren 26.& 73.5 774 Eral Public Health Suites Precata come in Chicago_by_year_1995_2009 (1) edited Help Tell me what you want to do Page Layout Formular Data Share 655 A E H 4.3 25 26 27 28 29 30 31 32 33 14 14 35 851 61 2.8 2.8 7.1 83.3 6 0.9 1.3 4,8 81 4.5 0.3 1 6.3 85.3 3 9.4 85.6 7.5 1.5 2.6 9.7 89.7 5.8 13 5 25 927 68 8 8 47 733 22 1 43 87.6 6.4 0.8 0.3 44 877 1 0.2 2.7 85.6 4.9 0.3 0.3 3.2 85.5 4.6 0.3 3.4 LB 5.9 89.5 7.9 1.3 1.3 5.6 89.9 7.8 1.7 8 87.5 8 1 35 M6 37 38 19 40 41 5.B D 5 NORTH CENTER 3RD TRIMESTER 5 NORTH CENTER NO PRENATAL CARE 5 NORTH CENTER NOT GIVEN 5 LAKE VIEW IST TRIMESTER 6 LAKE VIEW NO TRIMESTER 6 LAKEVIEW 3RD TRIMESTER 6 LAKE VIEW NO PRENATAL CARE 6 LAKE VIEW NOT GIVEN 7 UNCOLN PARK IST TRIMESTER 7 UNCOLN PARK 2ND TRIMESTER 7 LINCOLN PARK 3RD TRIMESTER 7 UNCOLN PARK NO PRENATAL CARE 7 UNCOLN PARK NOT GIVEN NEAR NORTH SIDE 1ST TRIMESTER NEAR NORTH SIDE 2ND TRIMESTER NEAR NORTH SIDE 3RD TRIMESTER NEAR NORTH SIDE NO PRENATAL CARE B NEAR NORTH SIDE NOT GIVEN EDISON PARK 1ST TRIMESTER 9 EDISON PARK 2ND TRIMESTER EDISON PARK 3RD TRIMESTER EDISON PARK NOT GIVEN 10 NORWOOD PARK IST TUMESTER 10 NORWOOD PARK 2ND TRIMESTER 30 NORWOOD PARK 3RD TRIMESTER 30 NORWOOD PARK NO PRENATAL CARE Sheeft Sheet2 Public Health Statistics Pren 18 82 744 37 2 2 65 197 101 26 6.1 72.6 4.7 691 15 5.6 11 175 9.4 70.9 16.2 4,8 1.4 15.9 90.9 9 0.2 0.2 7.6 67.5 13.7 3.5 0.8 14,4 92.5 5.2 0 2.2 89.9 7.5 0.7 1.2 11.2 2.2 0.2 11.9 3.1 1.4 2 3 30 898 53 12 2 70 761 42 7 3 41 589 119 26 10 68 112 7 3 1 378 36 D D 7.2 2.1 10.8 39 524 116 43 10 68 136 0 1 2 368 38 $ 2 3.3 66 12.5 4 0.5 6.8 19.0 0.9 ec.Sc. 106 124 7 0 3 2 32 3 5 9. 7.) 44 45 46 42 40 49 50 41 0.7 14 876 7 92.8 10 34,5 6.3 90.2 117 1.2 05