

Question: So there will be 4 data sets. For each data set follow the analysis steps: 1. enter all data into excel 2. create a graph
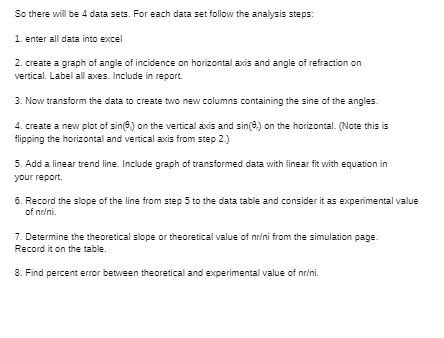
So there will be 4 data sets. For each data set follow the analysis steps: 1. enter all data into excel 2. create a graph of angle of incidence on horizontal axis and angle of refraction on vertical. Label all axes. Include in report. 3. Now transform the data to create two new columns containing the sine of the angles. 4. create a new plot of sin(3 ) on the vertical axis and sin(3.) on the horizontal. (Note this is flipping the horizontal and vertical axis from step 2.) 5. Add a linear trend line. Include graph of transformed data with linear fit with equation in your report. 6. Record the slope of the line from step 5 to the data table and consider it as experimental value of noni. 7. Determine the theoretical slope or theoretical value of noni from the simulation page. Record it on the table. 3. Find percent error between theoretical and experimental value of noni
Step by Step Solution
There are 3 Steps involved in it

Get step-by-step solutions from verified subject matter experts