

Question: so this is a same exercise but i had to do multiple screenshot to show everything please The following graph shows the marginal benefit (MB)
so this is a same exercise but i had to do multiple screenshot to show everything please
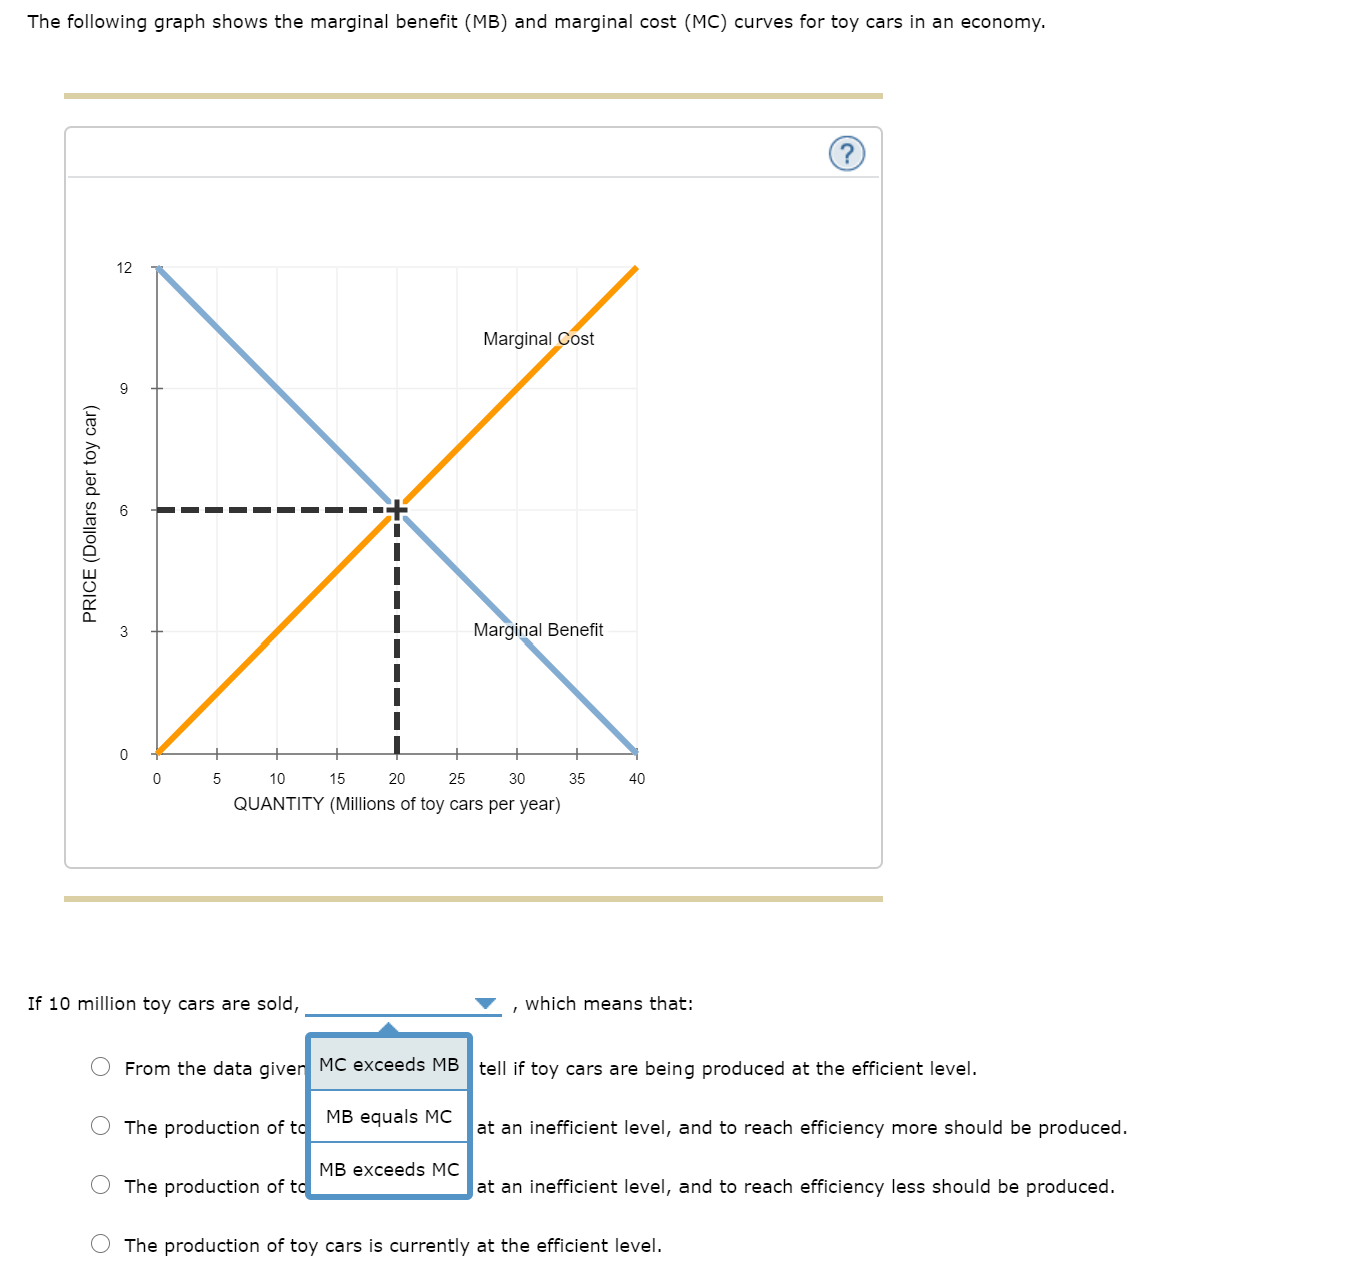
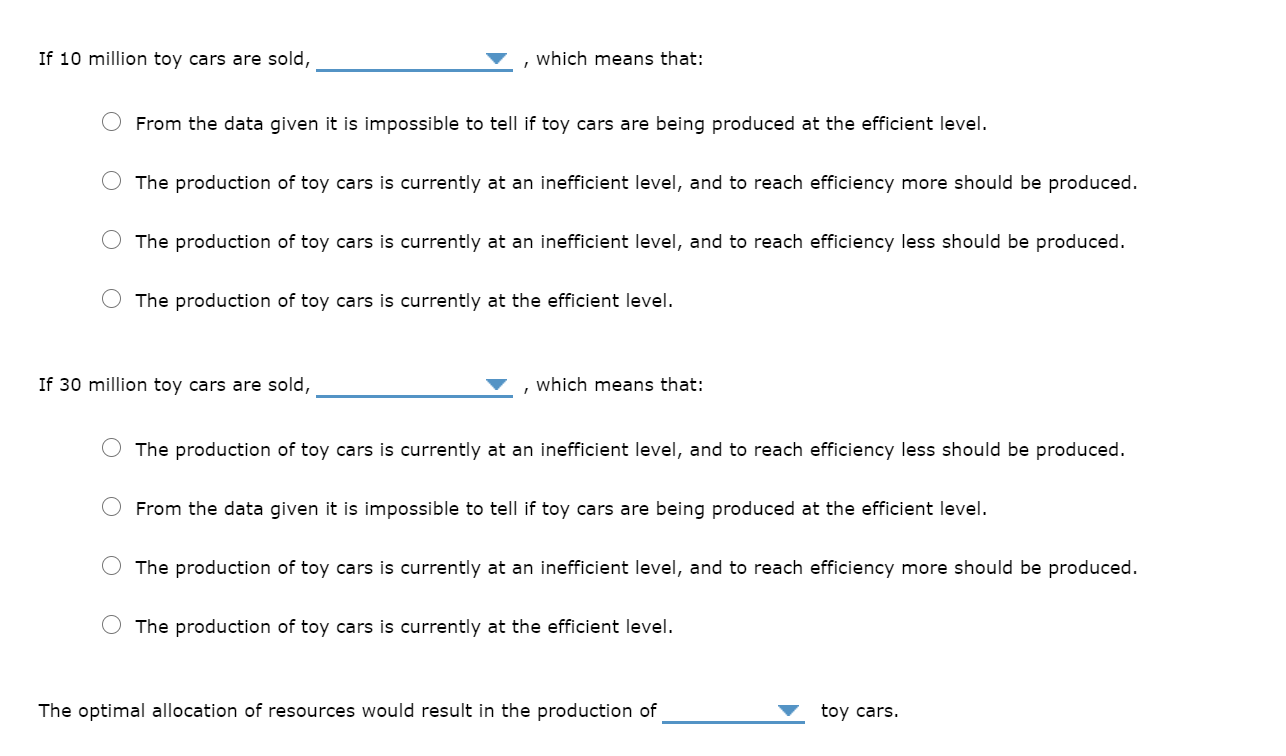
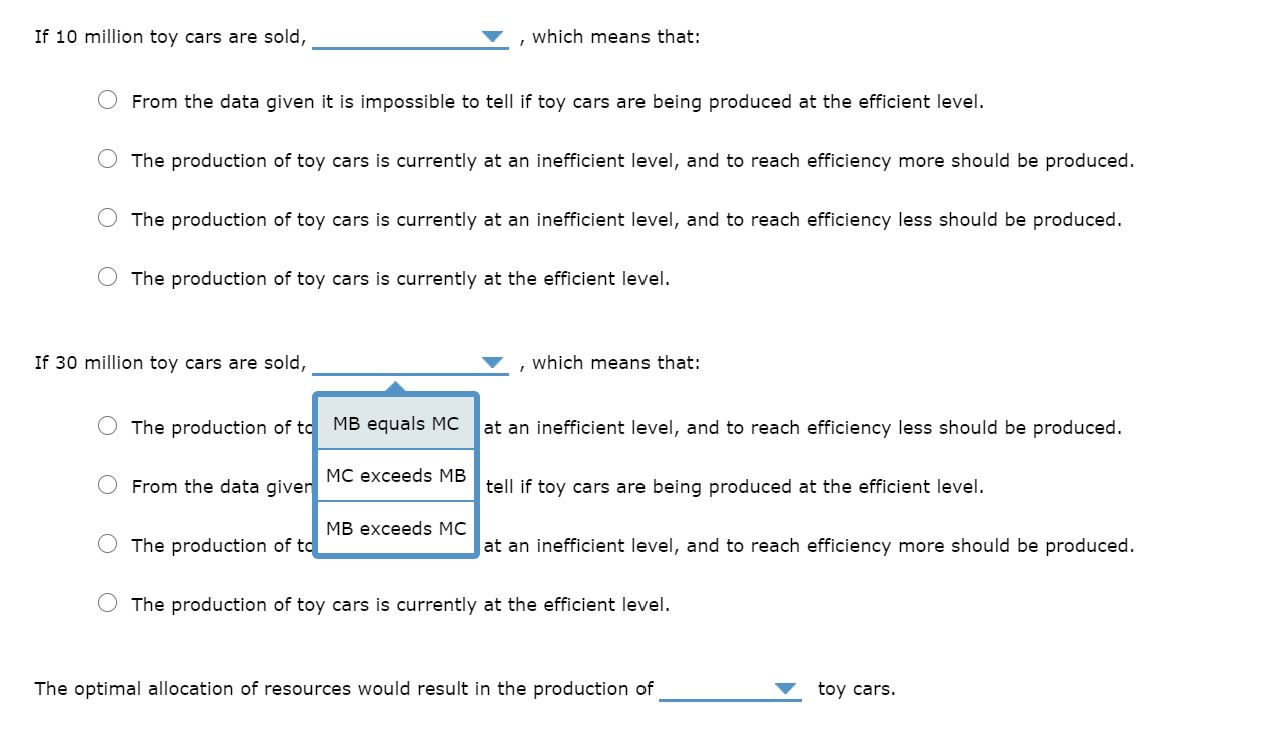
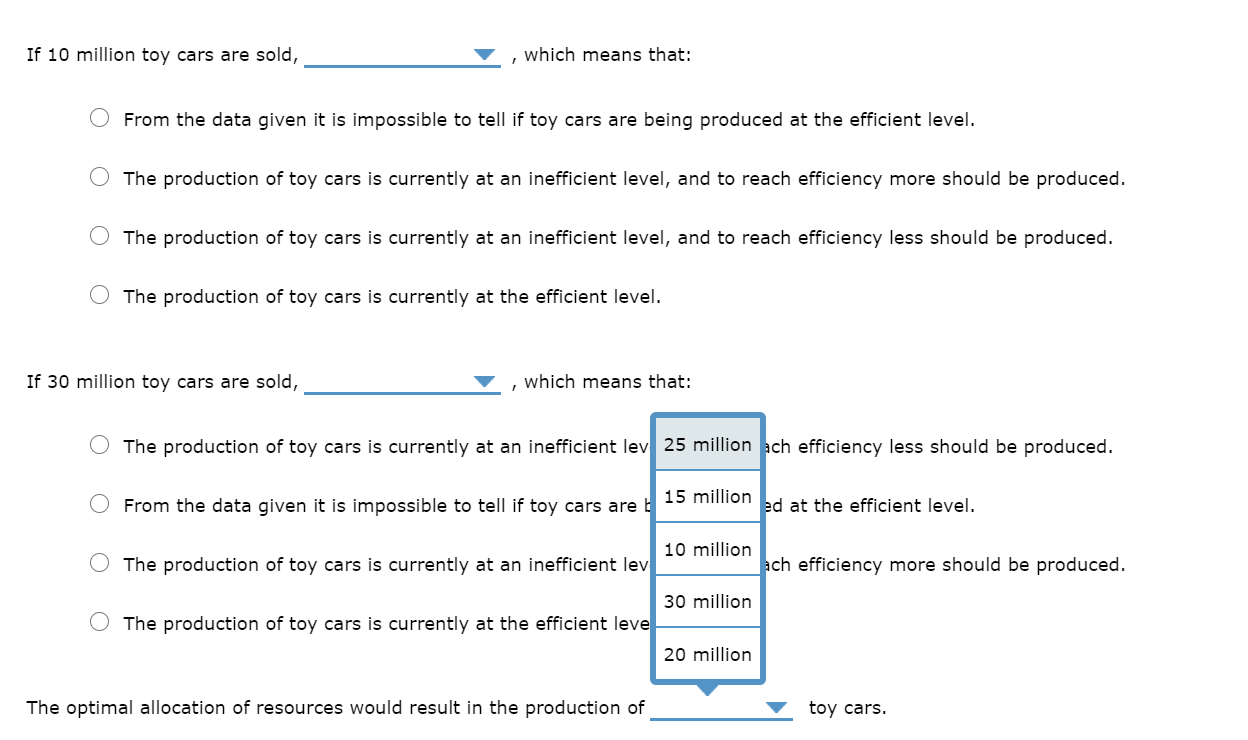
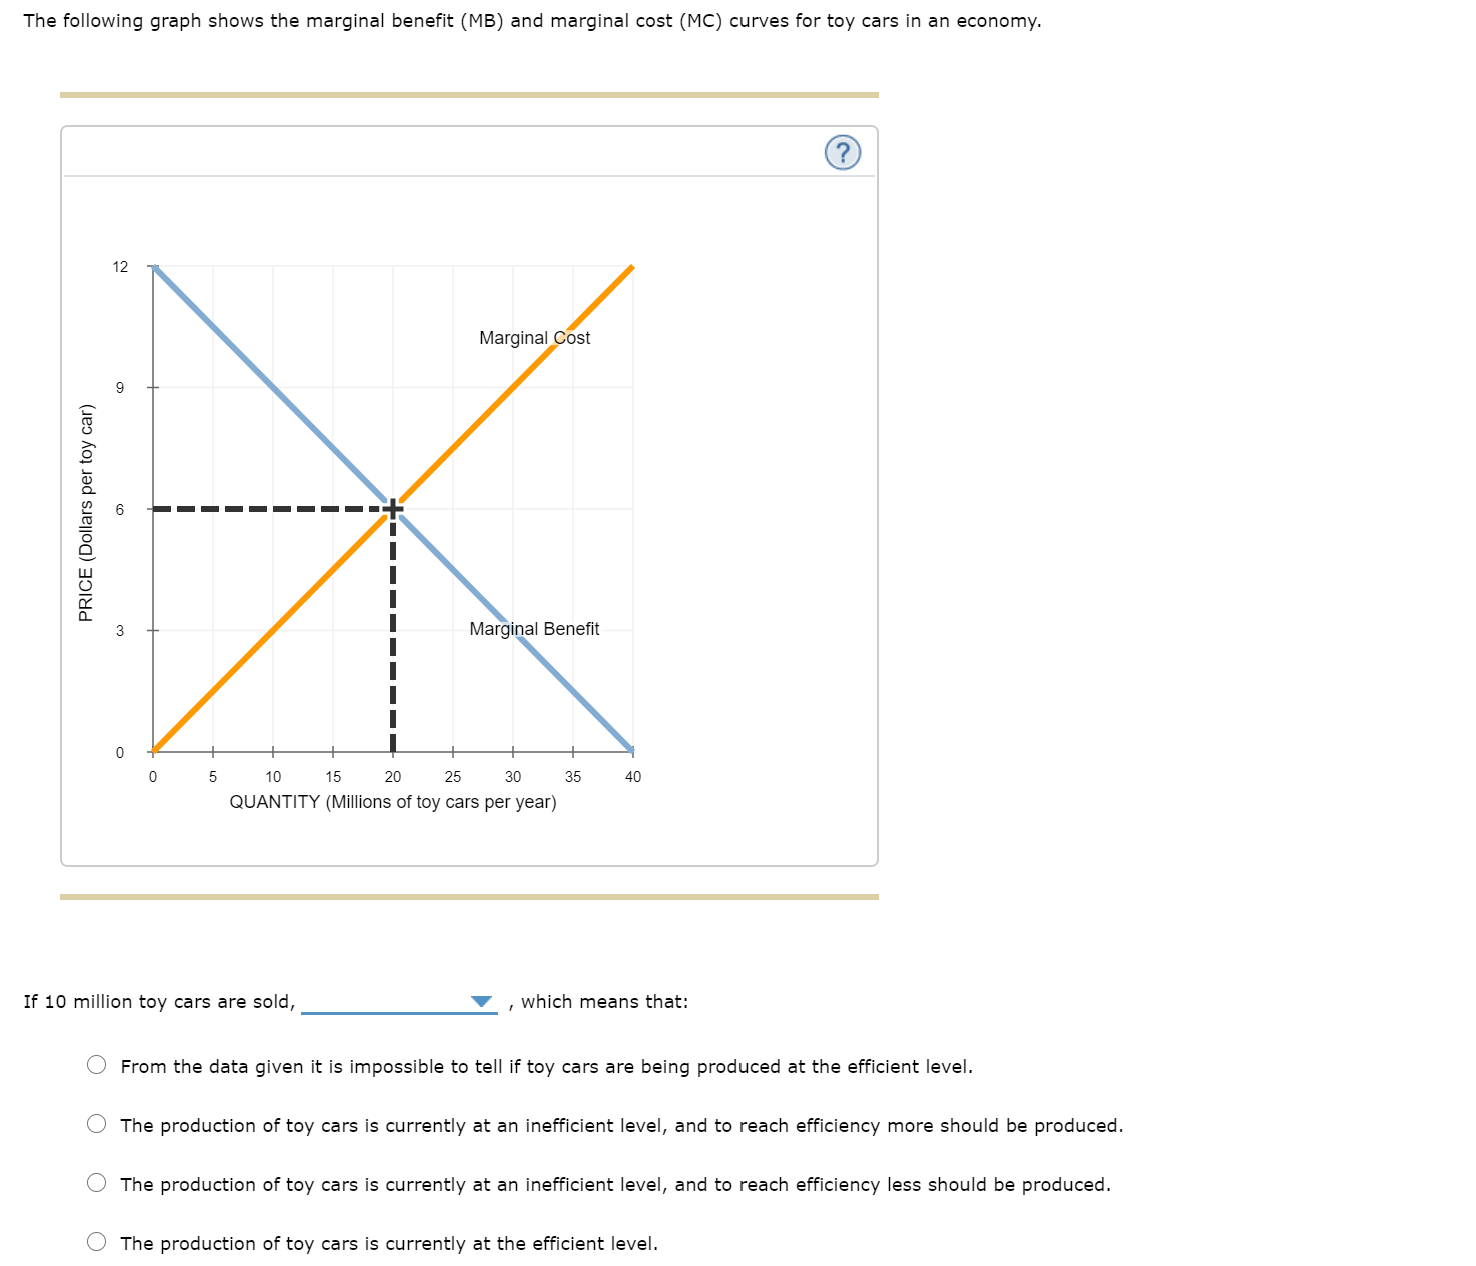
The following graph shows the marginal benefit (MB) and marginal cost (MC) curves for toy cars in an economy. (? 12 Marginal Cost 9 PRICE (Dollars per toy car) 6 w Marginal Benefit 5 10 15 20 25 30 35 40 QUANTITY (Millions of toy cars per year) If 10 million toy cars are sold, , which means that: O From the data giver MC exceeds MB tell if toy cars are being produced at the efficient level. The production of to MB equals MC at an inefficient level, and to reach efficiency more should be produced. The production of to MB exceeds MC at an inefficient level, and to reach efficiency less should be produced. The production of toy cars is currently at the efficient level.If 10 million toy cars are sold, , which means that: O From the data given it is impossible to tell if toy cars are being produced at the efficient level. O The production of toy cars is currently at an inefficient level, and to reach efficiency more should be produced. The production of toy cars is currently at an inefficient level, and to reach efficiency less should be produced. O The production of toy cars is currently at the efficient level. If 30 million toy cars are sold, , which means that: O The production of toy cars is currently at an inefficient level, and to reach efficiency less should be produced. O From the data given it is impossible to tell if toy cars are being produced at the efficient level. O The production of toy cars is currently at an inefficient level, and to reach efficiency more should be produced. O The production of toy cars is currently at the efficient level. The optimal allocation of resources would result in the production of toy cars.If 10 million toy cars are sold, , which means that: O From the data given it is impossible to tell if toy cars are being produced at the efficient level. O The production of toy cars is currently at an inefficient level, and to reach efficiency more should be produced. O The production of toy cars is currently at an inefficient level, and to reach efficiency less should be produced. The production of toy cars is currently at the efficient level. If 30 million toy cars are sold, , which means that: O The production of to MB equals MC at an inefficient level, and to reach efficiency less should be produced. O From the data giver MC exceeds MB tell if toy cars are being produced at the efficient level. O The production of to MB exceeds MC at an inefficient level, and to reach efficiency more should be produced. O The production of toy cars is currently at the efficient level. The optimal allocation of resources would result in the production of toy cars.If 10 million toy cars are sold, , which means that: From the data given it is impossible to tell if toy cars are being produced at the efficient level. O The production of toy cars is currently at an inefficient level, and to reach efficiency more should be produced. The production of toy cars is currently at an inefficient level, and to reach efficiency less should be produced. The production of toy cars is currently at the efficient level. If 30 million toy cars are sold, , which means that: The production of toy cars is currently at an inefficient lev 25 million ach efficiency less should be produced. O From the data given it is impossible to tell if toy cars are b 15 million ed at the efficient level. O The production of toy cars is currently at an inefficient lev 10 million ach efficiency more should be produced. 30 million O The production of toy cars is currently at the efficient leve 20 million The optimal allocation of resources would result in the production of toy cars.The following graph shows the marginal benefit (MB) and marginal cost (MC) curves for toy cars in an economy. (?) 12 Marginal Cost 9 PRICE (Dollars per toy car) 3 Marginal Benefit 10 15 20 25 30 35 40 QUANTITY (Millions of toy cars per year) If 10 million toy cars are sold, , which means that: O From the data given it is impossible to tell if toy cars are being produced at the efficient level. The production of toy cars is currently at an inefficient level, and to reach efficiency more should be produced. The production of toy cars is currently at an inefficient level, and to reach efficiency less should be produced. O The production of toy cars is currently at the efficient level
Step by Step Solution
There are 3 Steps involved in it

Get step-by-step solutions from verified subject matter experts