Question: solve 7.5- 7.6- 7.7- 7.10 336 Chapter 7 Control Charts for Attributes TABLE 7E.5 Inspection Data for Exercise 7.5 Number of Number of Nonconforming Lot
solve 7.5- 7.6- 7.7- 7.10
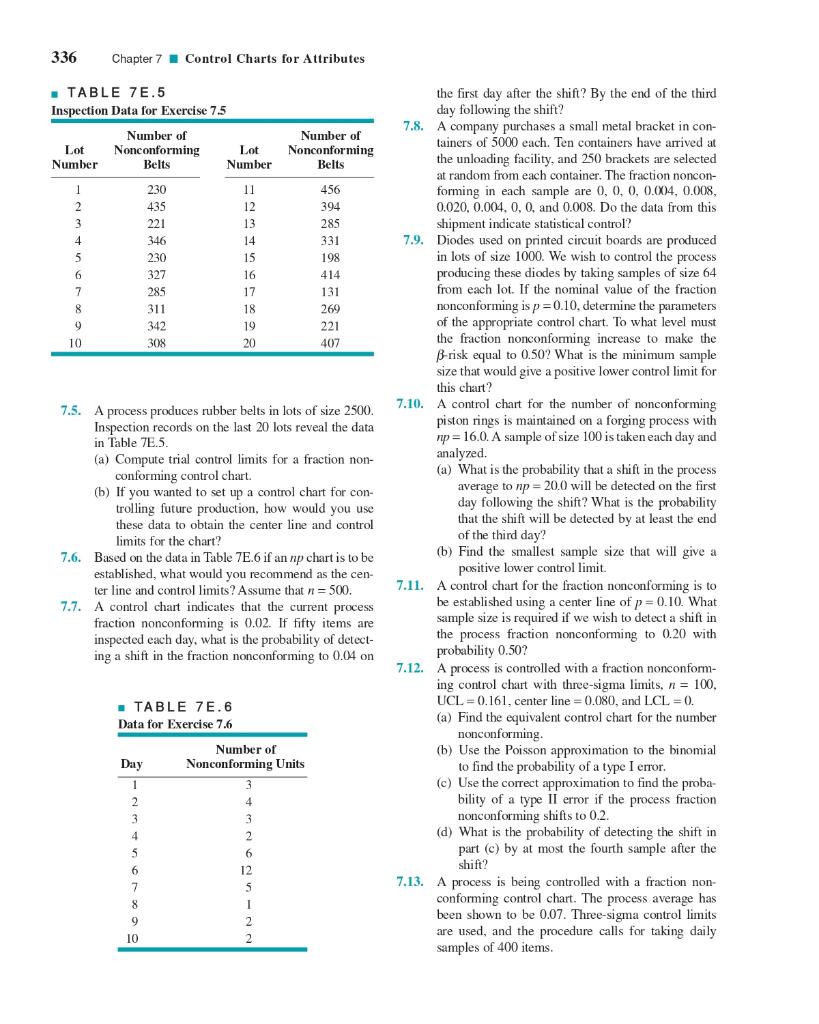
336 Chapter 7 Control Charts for Attributes TABLE 7E.5 Inspection Data for Exercise 7.5 Number of Number of Nonconforming Lot Number Nonconforming Belts Lot Number Belts 1 230 11 456 2 435 12 394 3 221 13 285 4 346 14 331 5 230 15 198 6 327 16 414 7 285 17 131 8 311 18 269 9 342 19 221 10 308 20 407 7.5. A process produces rubber belts in lots of size 2500. Inspection records on the last 20 lots reveal the data in Table 7E.5. (a) Compute trial control limits for a fraction non- conforming control chart. (b) If you wanted to set up a control chart for con- trolling future production, how would you use these data to obtain the center line and control limits for the chart? 7.6. Based on the data in Table 7E.6 if an np chart is to be established, what would you recommend as the cen- ter line and control limits? Assume that n = 500. 7.7. A control chart indicates that the current process fraction nonconforming is 0.02. If fifty items are inspected each day, what is the probability of detect- ing a shift in the fraction nonconforming to 0.04 on TABLE 7E.6 Data for Exercise 7.6 Number of Nonconforming Units Day 1 2 3 4 5 6 12 7 8 9 10 the first day after the shift? By the end of the third day following the shift? 7.8. A company purchases a small metal bracket in con- tainers of 5000 each. Ten containers have arrived at the unloading facility, and 250 brackets are selected at random from each container. The fraction noncon- forming in each sample are 0, 0, 0, 0.004, 0.008, 0.020, 0.004, 0, 0, and 0.008. Do the data from this shipment indicate statistical control? 7.9. Diodes used on printed circuit boards are produced in lots of size 1000. We wish to control the process producing these diodes by taking samples of size 64 from each lot. If the nominal value of the fraction nonconforming is p=0.10, determine the parameters of the appropriate control chart. To what level must the fraction nonconforming increase to make the B-risk equal to 0.50? What is the minimum sample size that would give a positive lower control limit for this chart? A control chart for the number of nonconforming piston rings is maintained on a forging process with np = 16.0. A sample of size 100 is taken each day and analyzed. (a) What is the probability that a shift in the process average to np=20.0 will be detected on the first day following the shift? What is the probability that the shift will be detected by at least the end of the third day? (b) Find the smallest sample size that will give a TE positive lower control limit. 7.11. A control chart for the fraction nonconforming is to be established using a center line of p=0.10. What sample size is required if we wish to detect a shift in the process fraction nonconforming to 0.20 with probability 0.50? 7.12. A process is controlled with a fraction nonconform- ing control chart with three-sigma limits, n = 100. UCL = 0.161, center line = 0.080, and LCL = 0. (a) Find the equivalent control chart for the number nonconforming. (b) Use the Poisson approximation to the binomial to find the probability of a type I error. Han (c) Use the correct approximation to find the proba- Lilia bility of a type II error if the process fraction nonconforming shifts to 0.2. (d) What is the probability of detecting the shift in part (c) by at most the fourth sample after the shift? 7.13. A process is being controlled with a fraction non- conforming control chart. The process average has been shown to be 0.07. Three-sigma control limits. are used, and the procedure calls for taking daily. samples of 400 items. 7.10


