

Question: solve all true and false 1. A bar chart is a great way to visualize the odds of the Casino Roulette. [T/F] 2. Humans are
solve all true and false 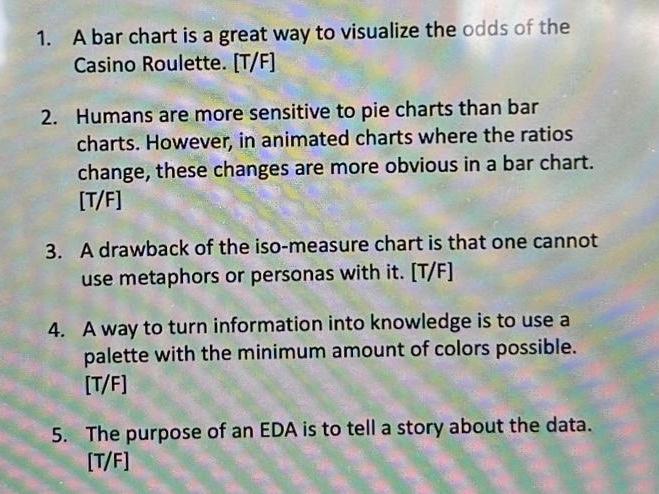
1. A bar chart is a great way to visualize the odds of the Casino Roulette. [T/F] 2. Humans are more sensitive to pie charts than bar charts. However, in animated charts where the ratios change, these changes are more obvious in a bar chart. [T/F] 3. A drawback of the iso-measure chart is that one cannot use metaphors or personas with it. [T/F] 4. A way to turn information into knowledge is to use a palette with the minimum amount of colors possible. [T/F] 5. The purpose of an EDA is to tell a story about the data. [T/F]
Step by Step Solution
There are 3 Steps involved in it
1 Expert Approved Answer
Step: 1 Unlock

Question Has Been Solved by an Expert!
Get step-by-step solutions from verified subject matter experts
Step: 2 Unlock
Step: 3 Unlock