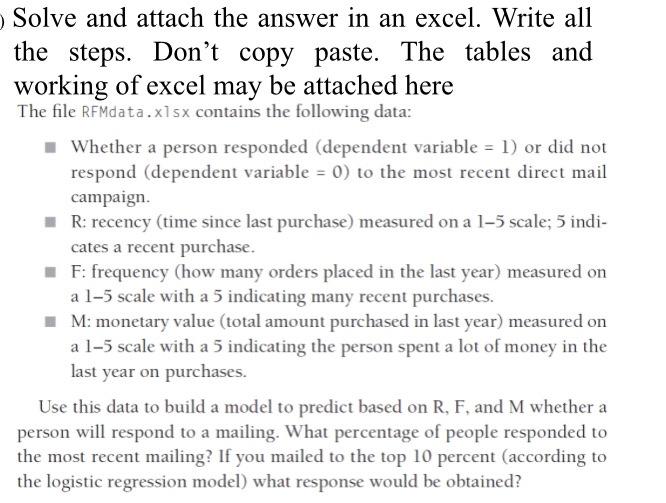
Question: Solve and attach the answer in an excel. Write all the steps. Don't copy paste. The tables and working of excel may be attached here

Solve and attach the answer in an excel. Write
Solve and attach the answer in an excel. Write all the steps. Don't copy paste. The tables and working of excel may be attached here The file REMdata.xlsx contains the following data: Whether a person responded (dependent variable = 1) or did not respond (dependent variable = 0) to the most recent direct mail campaign. R: recency (time since last purchase) measured on a 1-5 scale; 5 indi- cates a recent purchase. F: frequency (how many orders placed in the last year) measured on a l-5 scale with a 5 indicating many recent purchases. M: monetary value (total amount purchased in last year) measured on a l-5 scale with a 5 indicating the person spent a lot of money in the last year on purchases. Use this data to build a model to predict based on R, F. and M whether a person will respond to a mailing. What percentage of people responded to the most recent mailing? If you mailed to the top 10 percent (according to the logistic regression model) what response would be obtained

Step by Step Solution

There are 3 Steps involved in it

1 Expert Approved Answer
Step: 1 Unlock blur-text-image
Question Has Been Solved by an Expert!

Get step-by-step solutions from verified subject matter experts

Step: 2 Unlock
Step: 3 Unlock

Students Have Also Explored These Related General Management Questions!