

Question: Solve ASAP CORRECT SOLUTION WILL GIVE THUMBS UP.... SHOW ALL WORKING ..... Operational research Sewerage from a proposed treatment plant is to be pumped through
Solve ASAP CORRECT SOLUTION WILL GIVE THUMBS UP.... SHOW ALL WORKING ..... Operational research
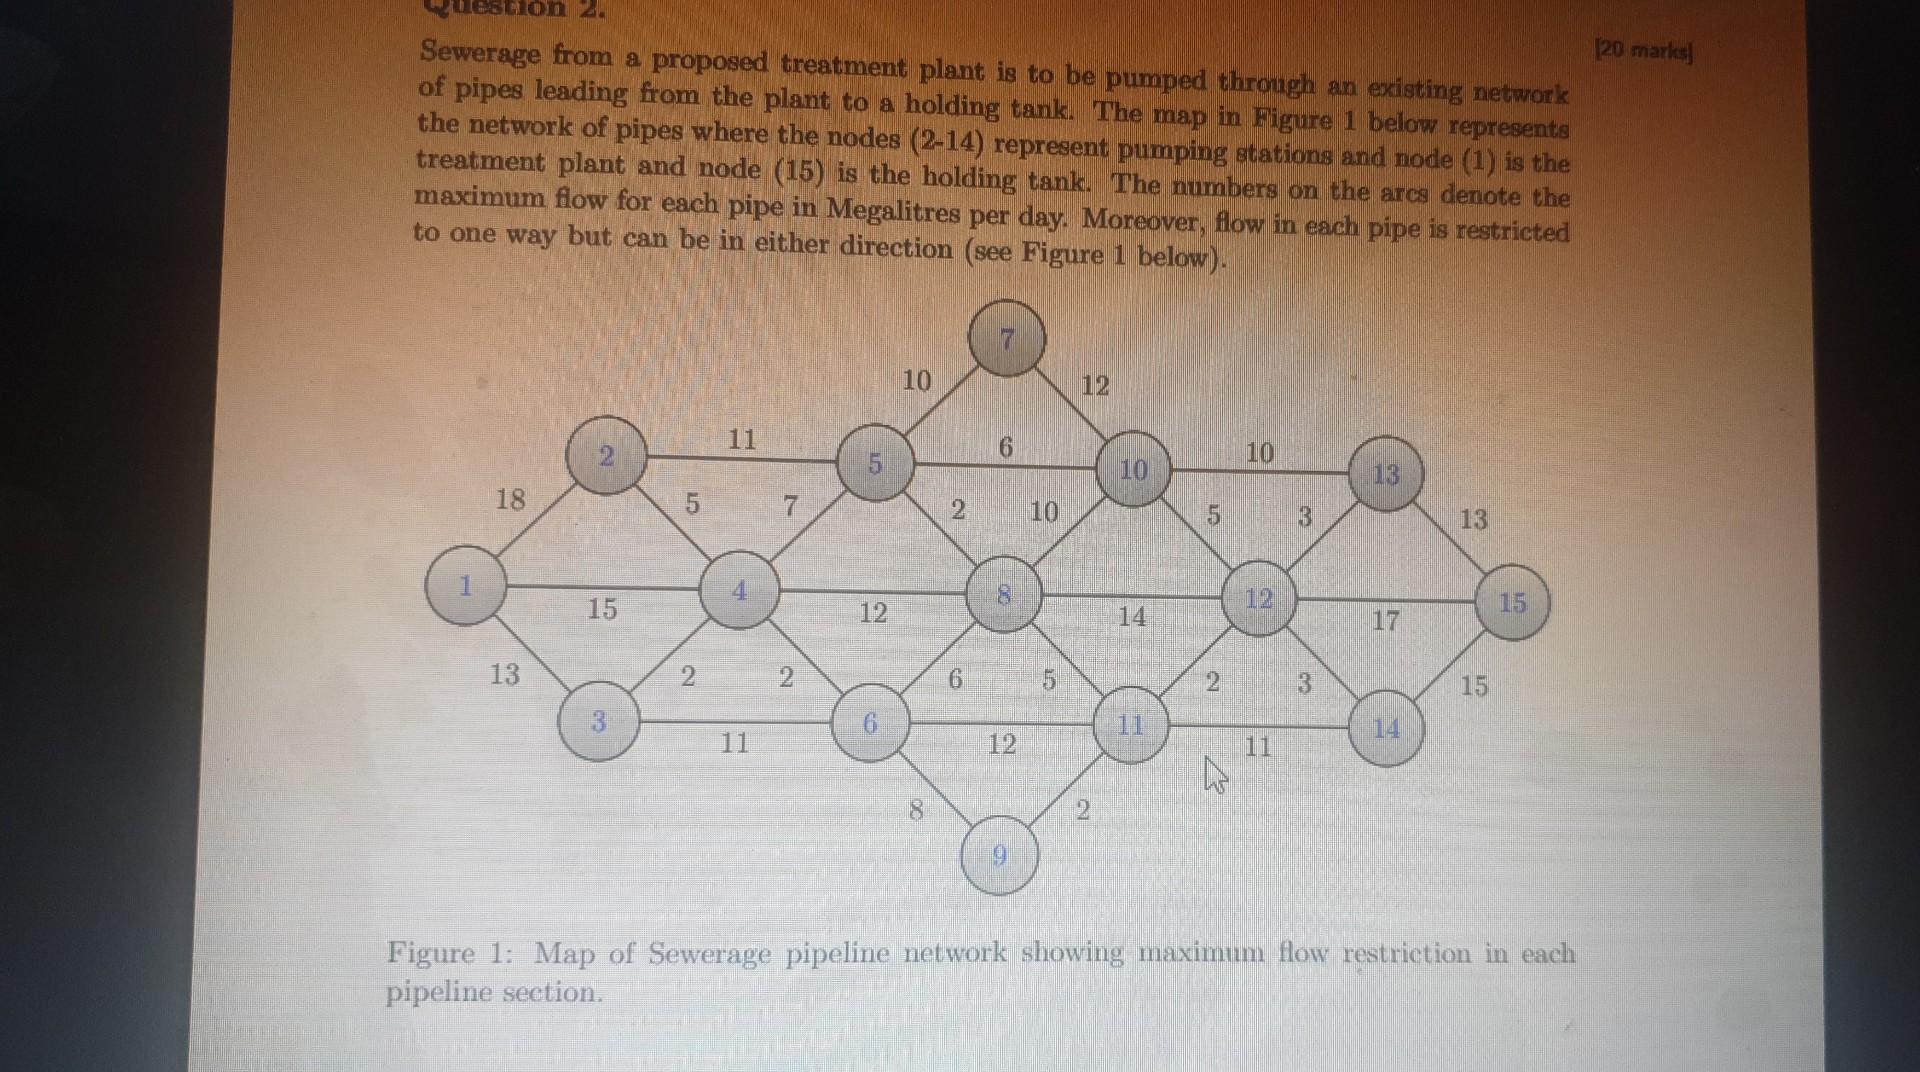
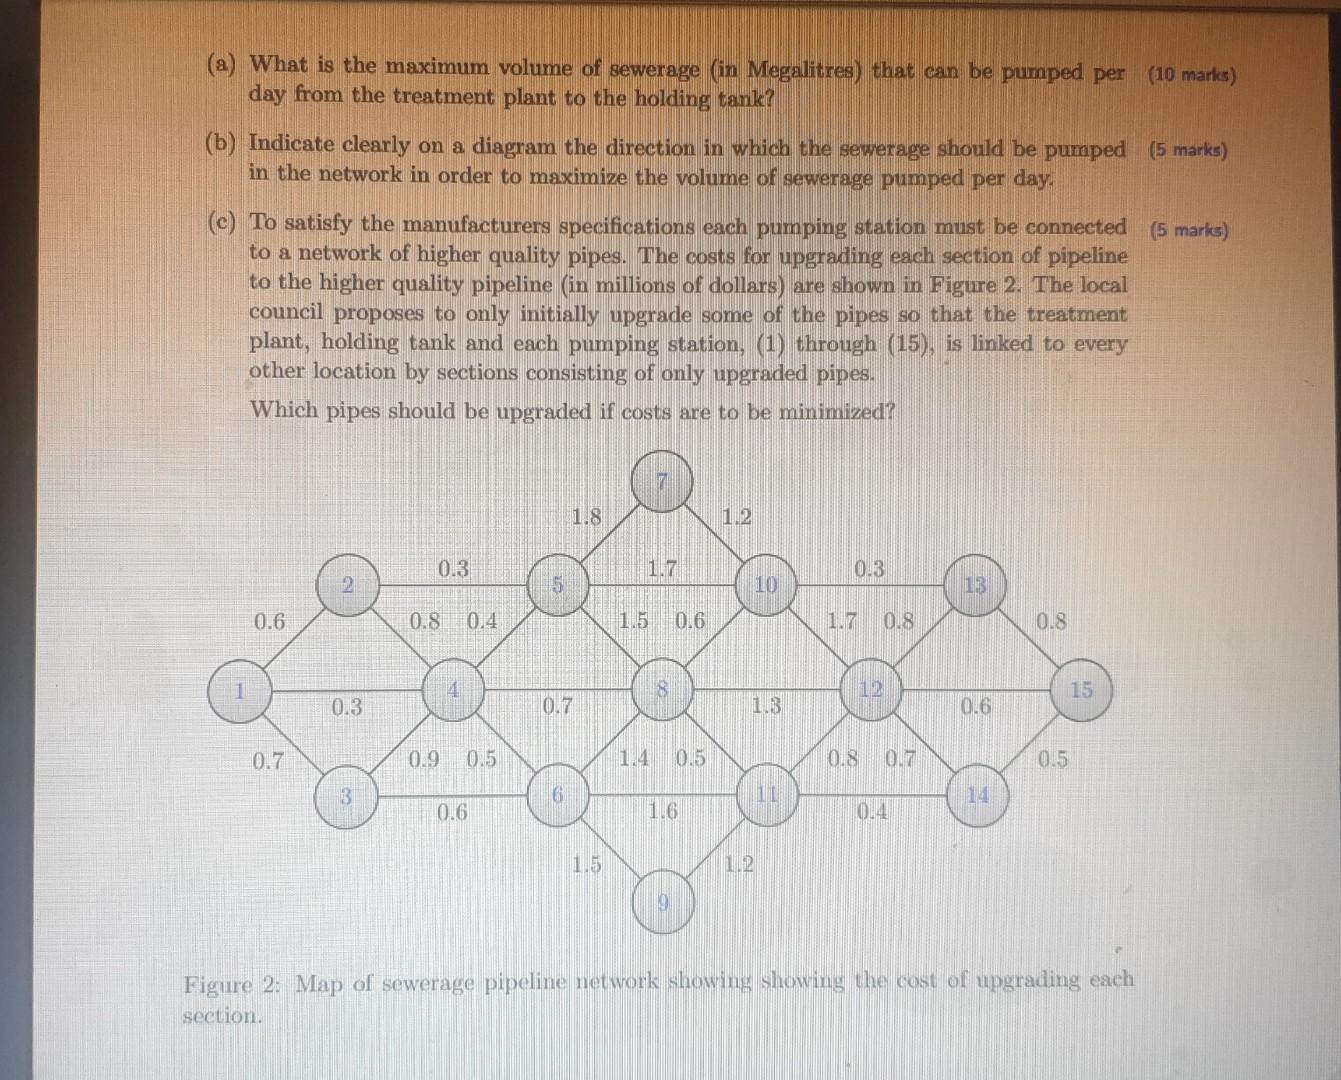
Sewerage from a proposed treatment plant is to be pumped through an existing network of pipes leading from the plant to a holding tank. The map in Figure 1 below represents the network of pipes where the nodes (2-14) represent pumping stations and node (1) is the treatment plant and node (15) is the holding tank. The numbers on the arcs denote the maximum flow for each pipe in Megalitres per day. Moreover, flow in each pipe is restricted to one way but can be in either direction (see Figure 1 below). Figure 1: Map of Sewerage pipeline network showing maximum flow restriction in each pipeline section. (a) What is the maximum volume of sewerage (in Megalitres) that can be pumped per (10 marks day from the treatment plant to the holding tank? (b) Indicate clearly on a diagram the direction in which the sewerage should be pumped ( 5 marks) in the network in order to maximize the volume of sewerage pumped per day. (c) To satisfy the manufacturers specifications each pumping station must be connected to a network of higher quality pipes. The costs for upgrading each section of pipeline to the higher quality pipeline (in millions of dollars) are shown in Figure 2. The local council proposes to only initially upgrade some of the pipes so that the treatment plant, holding tank and each pumping station, (1) through (15), is linked to every other location by sections consisting of only upgraded pipes. Which pipes should be upgraded if costs are to be minimized? Figure 2: Map of sewerage pipeline network showing showing the cost of upgrading each section. Sewerage from a proposed treatment plant is to be pumped through an existing network of pipes leading from the plant to a holding tank. The map in Figure 1 below represents the network of pipes where the nodes (2-14) represent pumping stations and node (1) is the treatment plant and node (15) is the holding tank. The numbers on the arcs denote the maximum flow for each pipe in Megalitres per day. Moreover, flow in each pipe is restricted to one way but can be in either direction (see Figure 1 below). Figure 1: Map of Sewerage pipeline network showing maximum flow restriction in each pipeline section. (a) What is the maximum volume of sewerage (in Megalitres) that can be pumped per (10 marks day from the treatment plant to the holding tank? (b) Indicate clearly on a diagram the direction in which the sewerage should be pumped ( 5 marks) in the network in order to maximize the volume of sewerage pumped per day. (c) To satisfy the manufacturers specifications each pumping station must be connected to a network of higher quality pipes. The costs for upgrading each section of pipeline to the higher quality pipeline (in millions of dollars) are shown in Figure 2. The local council proposes to only initially upgrade some of the pipes so that the treatment plant, holding tank and each pumping station, (1) through (15), is linked to every other location by sections consisting of only upgraded pipes. Which pipes should be upgraded if costs are to be minimized? Figure 2: Map of sewerage pipeline network showing showing the cost of upgrading eachStep by Step Solution
There are 3 Steps involved in it
1 Expert Approved Answer
Step: 1 Unlock

Question Has Been Solved by an Expert!
Get step-by-step solutions from verified subject matter experts
Step: 2 Unlock
Step: 3 Unlock