

Question: solve exercise 5.13 from Bayesian data Analysis from Andrew Gelman using stan and 'noninformative' hyperprior using stan? I don't know to the right way to
solve exercise 5.13 from Bayesian data Analysis from Andrew Gelman using stan and 'noninformative' hyperprior using stan? I don't know to the right way to create the stan model.
The 5.13 question is (keep in mind that I want to solve using Stan and noninformative hyperpriors - the book is free and available at: https://users.aalto.fi/~ave/BDA3.pdf) :
"Exercise 3.8 described a survey of bicycle traffic in Berkeley, California, with data displayed in Table 3.3. For this problem, restrict your attention to the first two rows of the table: residential streets labeled as 'bike routes,' which we will use to illustrate this computational exercise.
(a) Set up a model for the data in Table3.3so that, for j= 1,...,10, the observed number of bicycles at location j is binomial with unknown probability ?j and sample size equal to the total number of vehicles (bicycles included) in that block. The parameter ?j can be interpreted as the underlying or 'true' proportion of traffic at location j that is bicycles. (See Exercise3.8.) Assign a beta population distribution for the parameters ?j and a noninformative hyperprior distribution as in the rat tumor example of Section 5.3. Write down the joint posterior distribution.
(b) Compute the marginal posterior density of the hyperparameters and draw simulations from the joint posterior distribution of the parameters and hyperparameters, as in Section 5.3.
(c) Compare the posterior distributions of the parameters ?j to the raw proportions, (number of bicycles/total number of vehicles) in location j. How do the inferences from the posterior distribution differ from the raw proportions?
(d) Give a 95% posterior interval for the average underlying proportion of traffic that is bicycles.
(e) A new city block is sampled at random and is a residential street with a bike route. In an hour of observation, 100 vehicles of all kinds go by. Give a 95% posterior interval for the number of those vehicles that are bicycles. Discuss how much you trust this interval in application.
(f) Was the beta distribution for the ?j's reasonable?
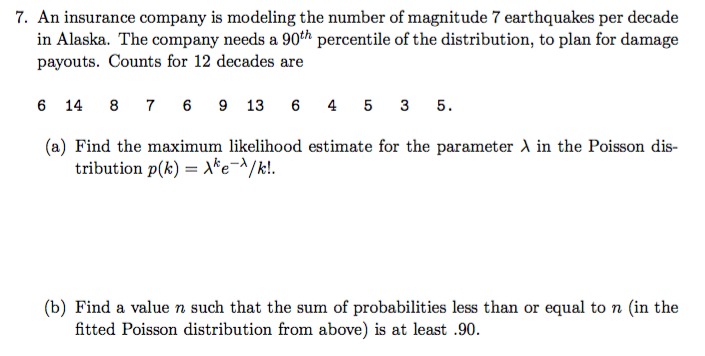
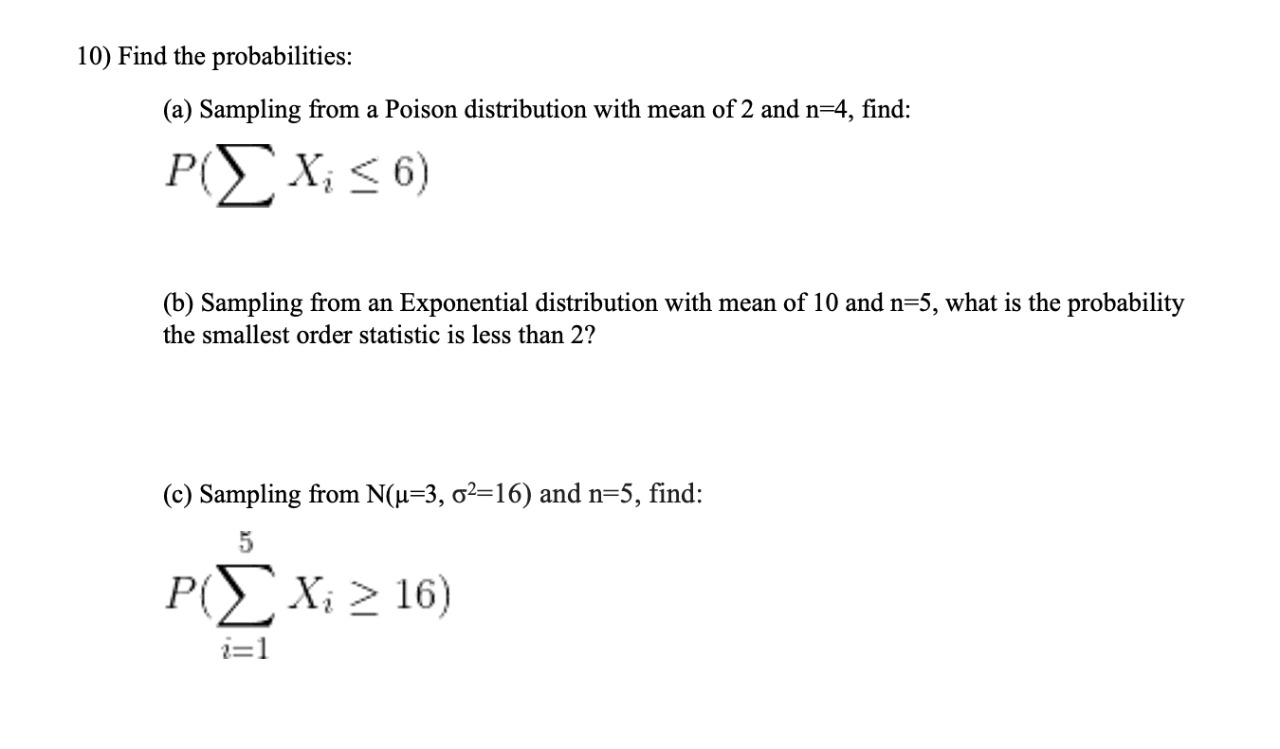

7. An insurance company is modeling the number of magnitude 7 earthquakes per decade in Alaska. The company needs a 90th percentile of the distribution, to plan for damage payouts. Counts for 12 decades are 6 14 8 7 6 9 13 6 4 5 3 5. (a) Find the maximum likelihood estimate for the parameter A in the Poisson dis- tribution p(k) = Ake-*/k!. (b) Find a value n such that the sum of probabilities less than or equal to n (in the fitted Poisson distribution from above) is at least .90.10) Find the probabilities: (a) Sampling from a Poison distribution with mean of 2 and n=4, find: P(EXi S 6) (b) Sampling from an Exponential distribution with mean of 10 and n=5, what is the probability the smallest order statistic is less than 2? (c) Sampling from N(u=3, 62=16) and n=5, find: 5 P( Xi 2 16) i=11 - Une the Poisson model to approximate the probability. Round your answer to four decimal places. TO 10) The rate of defects among CD players of a certain brand is $109.2521 1.% Use the Poison approximation to the binomial wor fag elles to isd dlotribution to find the probability that among 500 such CD saba se Ymol playere received by a store, there are exactly three defective CD playero. 2
Step by Step Solution
There are 3 Steps involved in it

Get step-by-step solutions from verified subject matter experts