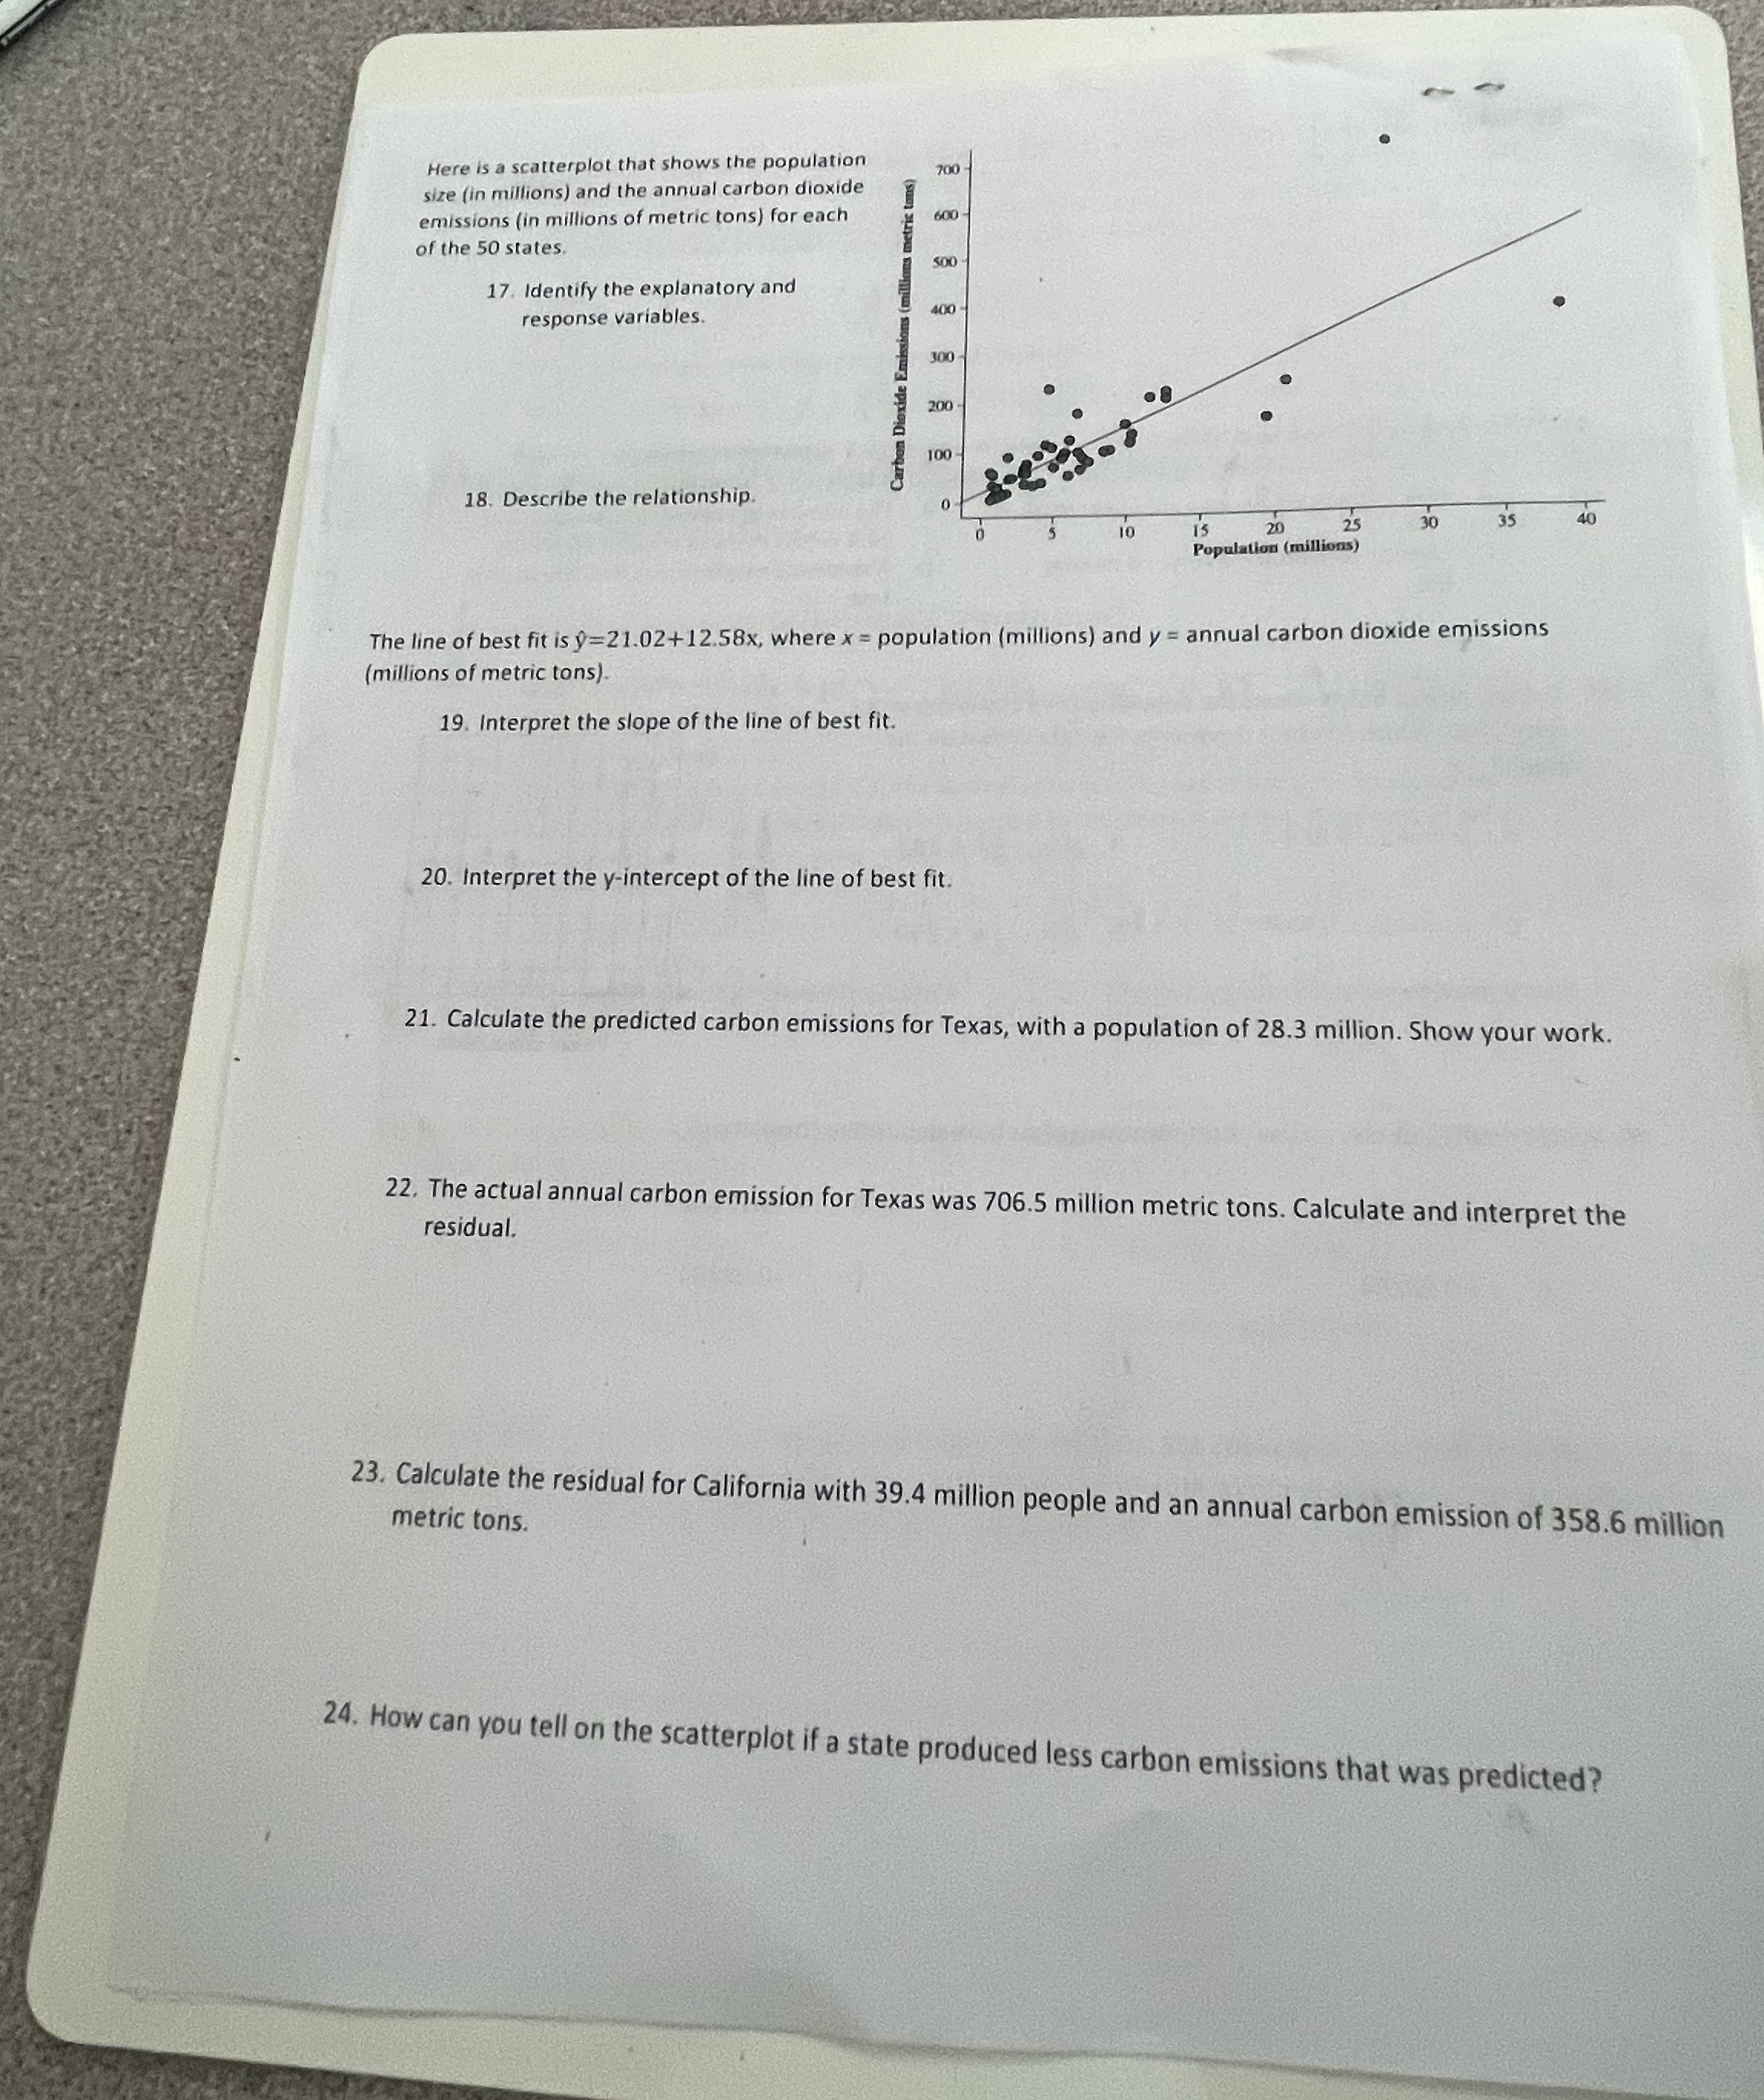
Question: Solve for each question please Here is a scatterplot that shows the population size (in millions) and the annual carbon dioxide 700 emissions (in millions

Solve for each question please

Solve for each question please Here is a
Here is a scatterplot that shows the population size (in millions) and the annual carbon dioxide 700 emissions (in millions of metric tons) for each netric tans) 600 of the 50 states. 500 17. Identify the explanatory and response variables. 400 300 200 . 8 Carbon Dioxid 100 18. Describe the relationship. 10 30 35 40 Population ( millions ) The line of best fit is y=21.02+12.58x, where x = population (millions) and y = annual carbon dioxide emissions (millions of metric tons) 19. Interpret the slope of the line of best fit. 20. Interpret the y-intercept of the line of best fit. 21. Calculate the predicted carbon emissions for Texas, with a population of 28.3 million. Show your work. residual. 22. The actual annual carbon emission for Texas was 706.5 million metric tons. Calculate and interpret the metric tons. 23. Calculate the residual for California with 39.4 million people and an annual carbon emission of 358.6 million 24. How can you tell on the scatterplot if a state produced less carbon emissions that was predicted

Step by Step Solution

There are 3 Steps involved in it

1 Expert Approved Answer
Step: 1 Unlock blur-text-image
Question Has Been Solved by an Expert!

Get step-by-step solutions from verified subject matter experts

Step: 2 Unlock
Step: 3 Unlock

Students Have Also Explored These Related Mathematics Questions!