

Question: SOLVE FOR _______ GIVEN- import numpy as np import pandas as pd import matplotlib.pyplot as plt T =10.0; # 10 year period dt=1.0/12.0; # dt
SOLVE FOR _______ GIVEN-
import numpy as np import pandas as pd import matplotlib.pyplot as plt
T =10.0; # 10 year period dt=1.0/12.0; # dt = 1/12 -- 1 month sd = 0.12; # standard deviation gamma = 0.03; # r = gamma base1 = 120 ; # initial price S_0 = $120 n_path = 500 # number of paths (no. of trails)
prices = np.zeros(int(T/dt)) end_prices = np.zeros(n_path) prices[0] = base1
paths = pd.DataFrame(prices) # Define a pandas.DataFrame for j in range(0, 501): for i in range (1,____)): # Generate prices for j-th path prices[i] = _________________________________________________ # price for i-th time-period paths[j] = _________________ # Adding the j-th column to the DataFrame end_prices[j] = __________________ # Store the ending price to an vectore. # plt.plot(prices) print ("Ending Price[mean, std, min , max] = [{0}, {1}, {2}, {3}]" .format(_____________, _____________,_____________,_____________))
plt.plot(paths.iloc[:,:____]); # Plot the first k-th paths in the DataFrame.
knock = ___________________________ # Defining the Threshold for a knock out knock
# For example, find in path 22, all the prices are equal or above mu+2*sigma s = paths[paths[22]>= knock][22] # Find the prices in path 22 that hit the knock out threshold print (s.size) min(s.index)
# Initialize # of Knockouts knockouts = 0 # for each path, find how many times the prices above the threshold? # Create a Pandas.Series to hold all the knockouts for i in range (0, n_path): ... ... knockouts += 1 print ("Number of knockouts: ", knockouts)
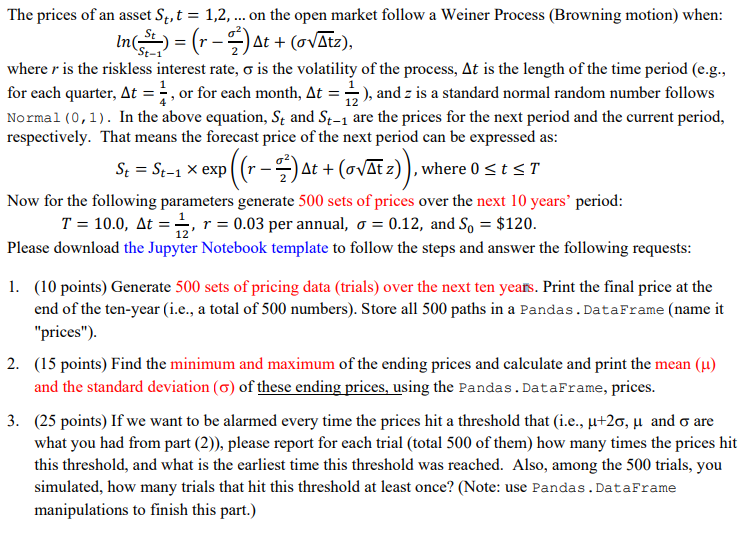
The prices of an asset St, t = 1,2, ... on the open market follow a Weiner Process (Browning motion) when: Inc.) = (r - *) t + (ovtz), where r is the riskless interest rate, o is the volatility of the process, At is the length of the time period (e.g., for each quarter, At =, or for each month, At = 1), and z is a standard normal random number follows Normal (0,1). In the above equation, St and St-1 are the prices for the next period and the current period, respectively. That means the forecast price of the next period can be expressed as: At Now for the following parameters generate 500 sets of prices over the next 10 years' period: T = 10.0, At = 1, r = 0.03 per annual, o = 0.12, and Sn = $120. Please download the Jupyter Notebook template to follow the steps and answer the following requests: 1. (10 points) Generate 500 sets of pricing data (trials) over the next ten years. Print the final price at the end of the ten-year (i.e., a total of 500 numbers). Store all 500 paths in a Pandas.DataFrame (name it "prices"). 2. (15 points) Find the minimum and maximum of the ending prices and calculate and print the mean (u) and the standard deviation () of these ending prices, using the Pandas.DataFrame, prices. 3. (25 points) If we want to be alarmed every time the prices hit a threshold that (i.e., u+20, u and o are what you had from part (2), please report for each trial (total 500 of them) how many times the prices hit this threshold, and what is the earliest time this threshold was reached. Also, among the 500 trials, you simulated, how many trials that hit this threshold at least once? (Note: use Pandas.DataFrame manipulations to finish this part.) The prices of an asset St, t = 1,2, ... on the open market follow a Weiner Process (Browning motion) when: Inc.) = (r - *) t + (ovtz), where r is the riskless interest rate, o is the volatility of the process, At is the length of the time period (e.g., for each quarter, At =, or for each month, At = 1), and z is a standard normal random number follows Normal (0,1). In the above equation, St and St-1 are the prices for the next period and the current period, respectively. That means the forecast price of the next period can be expressed as: At Now for the following parameters generate 500 sets of prices over the next 10 years' period: T = 10.0, At = 1, r = 0.03 per annual, o = 0.12, and Sn = $120. Please download the Jupyter Notebook template to follow the steps and answer the following requests: 1. (10 points) Generate 500 sets of pricing data (trials) over the next ten years. Print the final price at the end of the ten-year (i.e., a total of 500 numbers). Store all 500 paths in a Pandas.DataFrame (name it "prices"). 2. (15 points) Find the minimum and maximum of the ending prices and calculate and print the mean (u) and the standard deviation () of these ending prices, using the Pandas.DataFrame, prices. 3. (25 points) If we want to be alarmed every time the prices hit a threshold that (i.e., u+20, u and o are what you had from part (2), please report for each trial (total 500 of them) how many times the prices hit this threshold, and what is the earliest time this threshold was reached. Also, among the 500 trials, you simulated, how many trials that hit this threshold at least once? (Note: use Pandas.DataFrame manipulations to finish this part.)
Step by Step Solution
There are 3 Steps involved in it

Get step-by-step solutions from verified subject matter experts