

Question: Solve for the first chart An ad agency tracks the complaints, by week received, about the billboards in its city: Week No. of Complaints 600
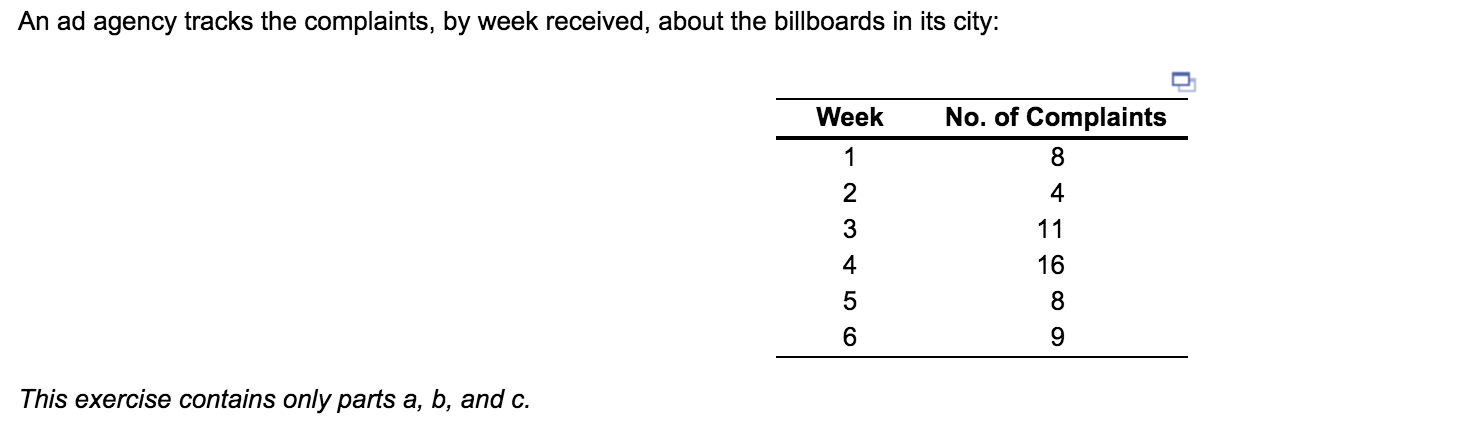
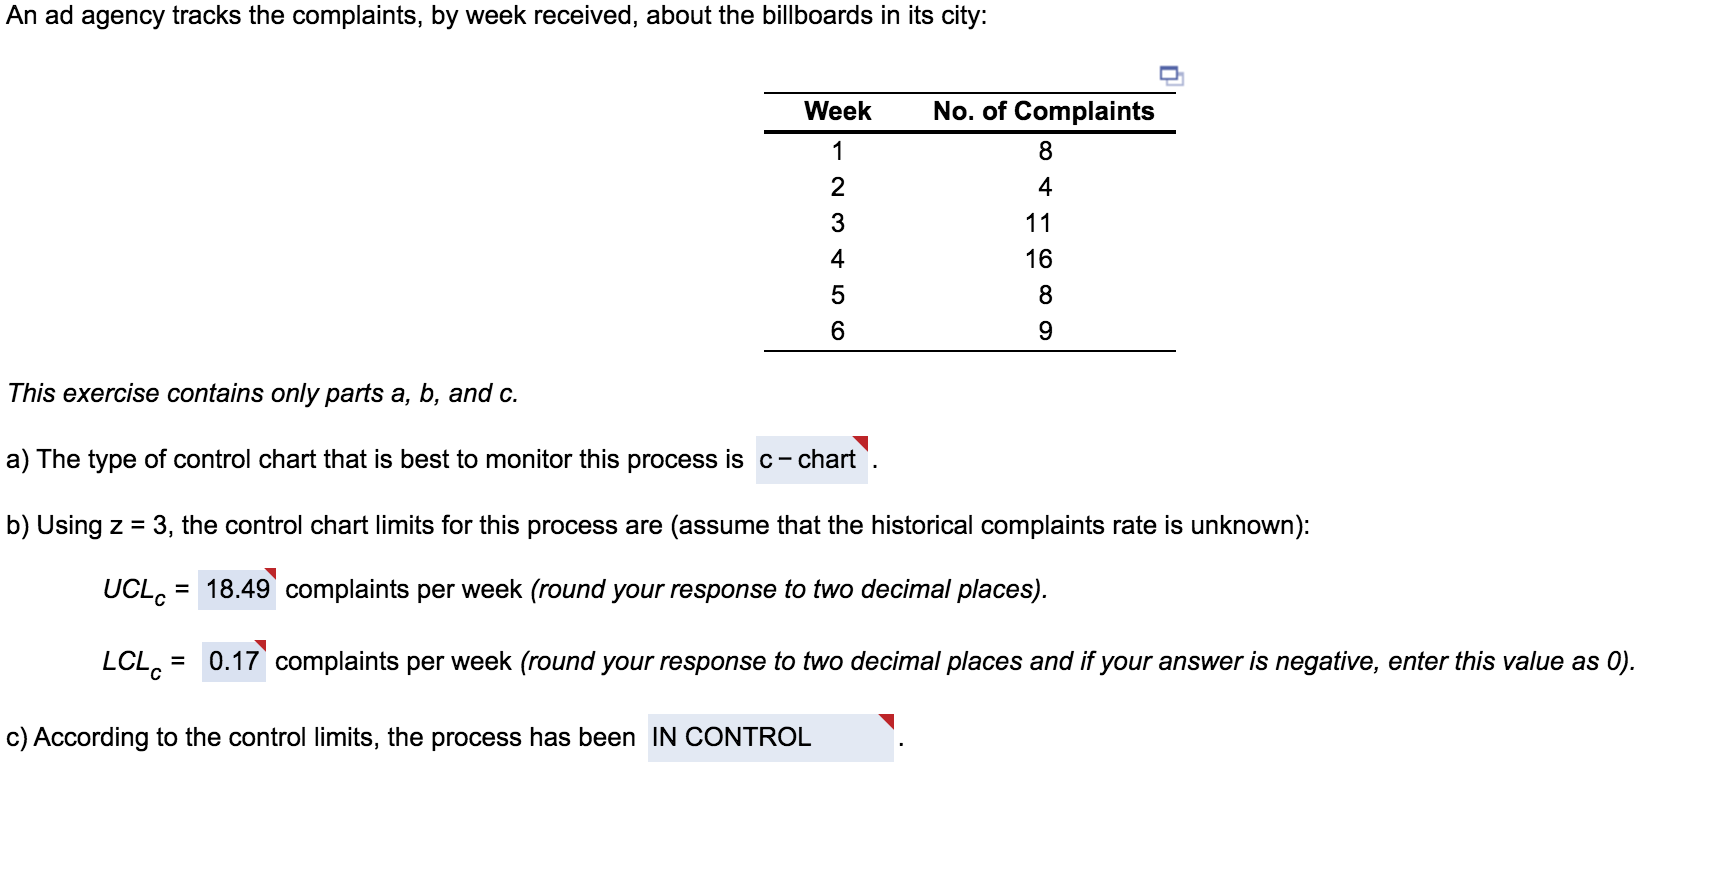 Solve for the first chart
Step by Step Solution
There are 3 Steps involved in it
1 Expert Approved Answer
Step: 1 Unlock

Question Has Been Solved by an Expert!
Get step-by-step solutions from verified subject matter experts
Step: 2 Unlock
Step: 3 Unlock