

Question: solve in 40 mins i will thumb up 3. The following two tables appear in the paper Can Hearts and Minds by Bought: The Economics
solve in 40 mins i will thumb up
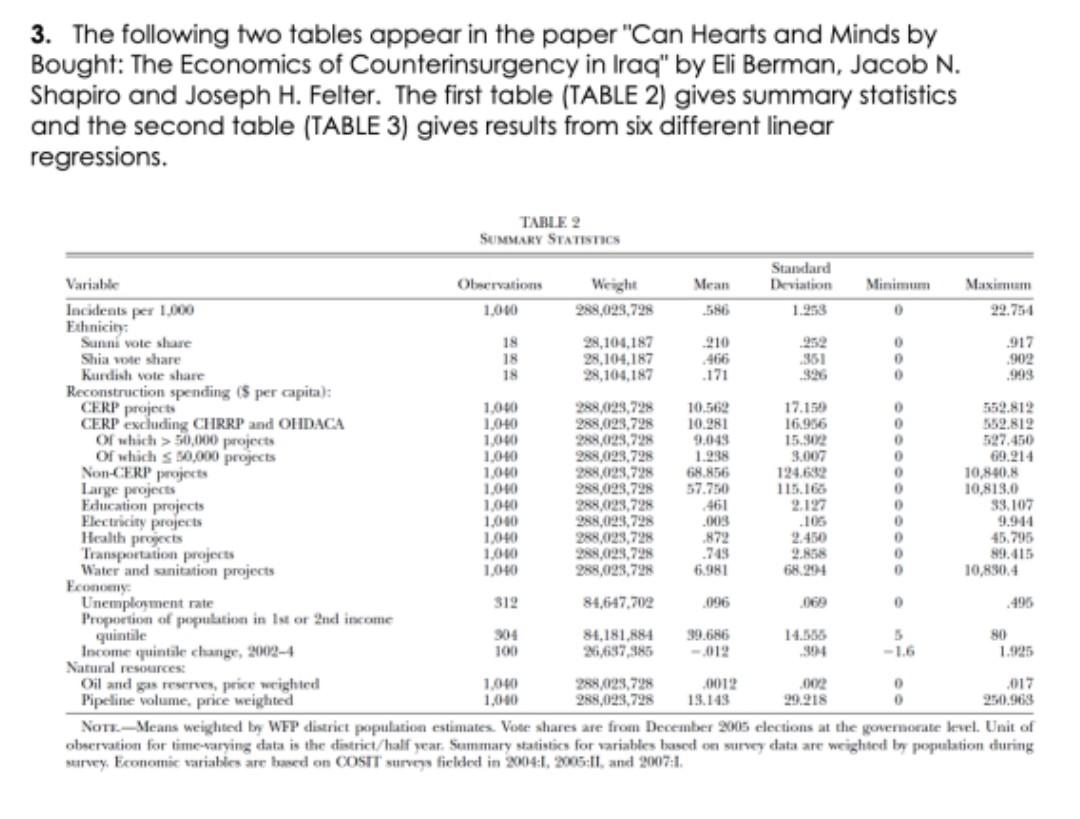
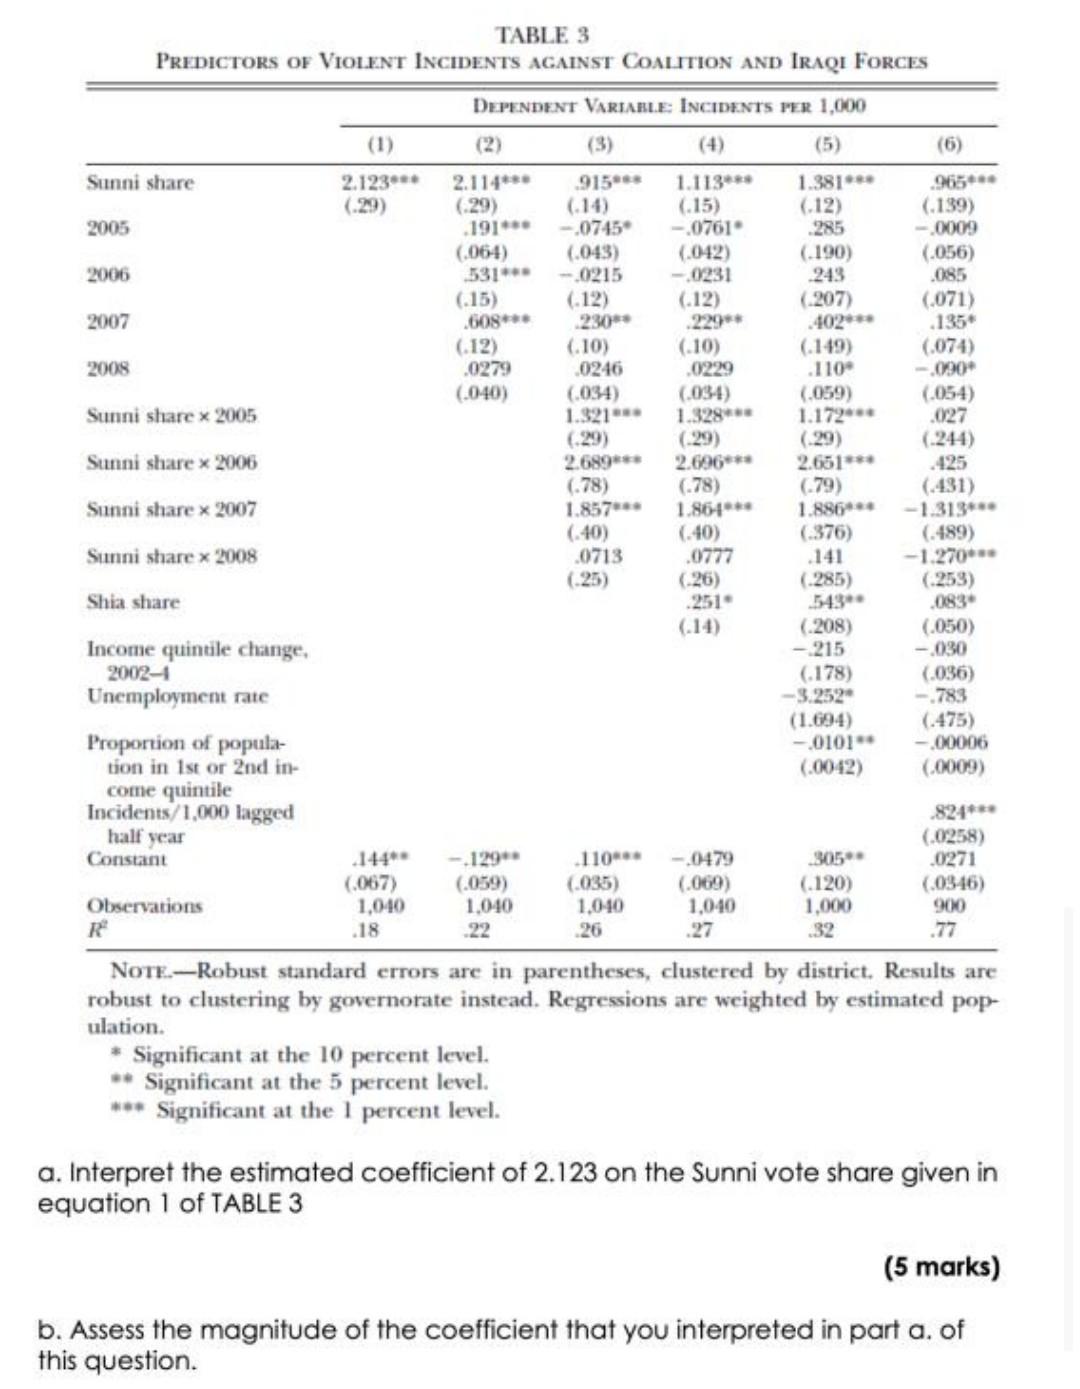
3. The following two tables appear in the paper "Can Hearts and Minds by Bought: The Economics of Counterinsurgency in Iraq" by Eli Berman, Jacob N. Shapiro and Joseph H. Felter. The first table (TABLE 2) gives summary statistics and the second table (TABLE 3) gives results from six different linear regressions. D D 0 0 O 0 TABLE 2 SUMMARY STATISTICS Standard Variable Observations Weight Mean Deviation Minimum Maximum Incidents per 1.000 1.000 288,023.728 586 1.258 O 22.754 Ethnicity: Sunni vole share 18 28, 104.187 210 .917 Shia wote share 18 28,104,187 .466 351 .902 Kurdish vole share 18 28,104,187 .171 .999 Reconstruction spending (5 per capita): CERP projects 1.000 288,029,728 10,562 17.150 552.812 CERP excluding CHRRP and OHDACA 1.040 288,023,728 10.281 16.956 852.812 Of which > 50,000 projects 1,040 288,023,728 9.049 15.302 527.450 Of which s 50,000 projects 1,040 288,023,728 1.238 3.007 69.214 Non-CERP projects 1.000 288,023,728 68.856 124.682 10,840.8 Large projects 1.010 288,023,728 57.750 115.165 10.813.0 Education projects 1.060 288,023,728 461 2.127 33.107 Electricity projects 1.000 288,023,728 .003 .105 1.040 288,023,728 872 2.450 45.795 Transportation projects 1.000 298,023,728 743 89.015 Water and sanitation projects 1.040 288,023,728 6.981 68.204 10,830.4 Economy Unemployment rate 312 84,647,702 096 .495 Proportion of population in Ist or 2nd income quintile 304 84,181.884 99.686 14.586 5 50 Income quintile change, 2002-4 100 26,637,385 304 -1.6 1.925 Natural resources Oil and gas reserves, price weighted 1.040 288,023,728 0012 .017 Pipeline volume, price weighted 1,040 288,023,728 13.143 29.218 O 250.968 Not-Means weighted by WFP district population estimates. Vote shares are from December 2005 elections at the governorate level. Unit of observation for time-varying data is the district/half year Summary statistics for variables based on survey data are weighted by population during survey, Economic variables are based on COSIT surveys ficided in 2004:1, 2005:11, and 2007:1. health projects D D D 0 -012 002 TABLE 3 PREDICTORS OF VIOLENT INCIDENTS AGAINST COALITION AND IRAQI FORCES DEPENDENT VARIABLE: INCIDENTS PER 1,000 (2) (3) (5) (6) Sunni share 2.123. 2.114*** 915 1.113 1.381 .965 (.29) (29) (.15) (12) (.139) 2005 .191 -.0745 - 0761 285 -.0009 (064) (.043) (.042) (.190) (056) 2006 531-0215 -0231 243 .085 (.15) (12) (.12) (207) 2007 (.071) .608*** 230 .229 .402 .135 (.12) (10) (.10) (149) (.074) 2008 .0279 0246 0229 .110 -.090 (040) (.034) (.034) (.059) (.054) Sunni share x 2005 1.321 1.328 1.172 .027 (29) (-29) (244) Sunni share 50,000 projects 1,040 288,023,728 9.049 15.302 527.450 Of which s 50,000 projects 1,040 288,023,728 1.238 3.007 69.214 Non-CERP projects 1.000 288,023,728 68.856 124.682 10,840.8 Large projects 1.010 288,023,728 57.750 115.165 10.813.0 Education projects 1.060 288,023,728 461 2.127 33.107 Electricity projects 1.000 288,023,728 .003 .105 1.040 288,023,728 872 2.450 45.795 Transportation projects 1.000 298,023,728 743 89.015 Water and sanitation projects 1.040 288,023,728 6.981 68.204 10,830.4 Economy Unemployment rate 312 84,647,702 096 .495 Proportion of population in Ist or 2nd income quintile 304 84,181.884 99.686 14.586 5 50 Income quintile change, 2002-4 100 26,637,385 304 -1.6 1.925 Natural resources Oil and gas reserves, price weighted 1.040 288,023,728 0012 .017 Pipeline volume, price weighted 1,040 288,023,728 13.143 29.218 O 250.968 Not-Means weighted by WFP district population estimates. Vote shares are from December 2005 elections at the governorate level. Unit of observation for time-varying data is the district/half year Summary statistics for variables based on survey data are weighted by population during survey, Economic variables are based on COSIT surveys ficided in 2004:1, 2005:11, and 2007:1. health projects D D D 0 -012 002 TABLE 3 PREDICTORS OF VIOLENT INCIDENTS AGAINST COALITION AND IRAQI FORCES DEPENDENT VARIABLE: INCIDENTS PER 1,000 (2) (3) (5) (6) Sunni share 2.123. 2.114*** 915 1.113 1.381 .965 (.29) (29) (.15) (12) (.139) 2005 .191 -.0745 - 0761 285 -.0009 (064) (.043) (.042) (.190) (056) 2006 531-0215 -0231 243 .085 (.15) (12) (.12) (207) 2007 (.071) .608*** 230 .229 .402 .135 (.12) (10) (.10) (149) (.074) 2008 .0279 0246 0229 .110 -.090 (040) (.034) (.034) (.059) (.054) Sunni share x 2005 1.321 1.328 1.172 .027 (29) (-29) (244) Sunni shareStep by Step Solution
There are 3 Steps involved in it
1 Expert Approved Answer
Step: 1 Unlock

Question Has Been Solved by an Expert!
Get step-by-step solutions from verified subject matter experts
Step: 2 Unlock
Step: 3 Unlock