

Question: solve in excel ) Calculate the forecast for 2020 using the Seasonal forecasting method we used in class. Also calculate MAD for this data set.
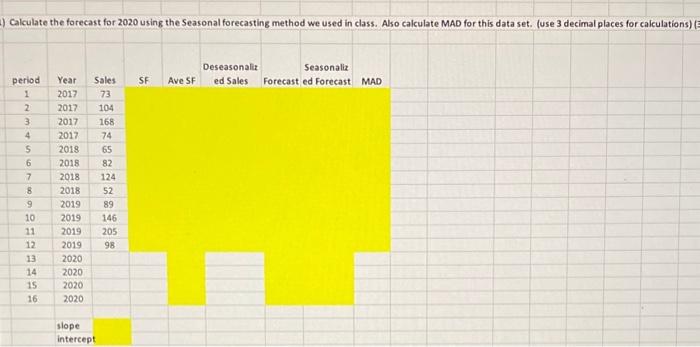
) Calculate the forecast for 2020 using the Seasonal forecasting method we used in class. Also calculate MAD for this data set. (use 3 decimal places for calculations) (3 \begin{tabular}{|c|c|c|c|c|} \hline & & & & \\ \hline period & Year & Sales & SF & Avesesonalit \\ \hline 1 & 2017 & 73 & \\ \hline 2 & 2017 & 104 \\ \hline 3 & 2017 & 168 \\ \hline 4 & 2017 & 74 \\ \hline 5 & 2018 & 65 \\ \hline 6 & 2018 & 82 \\ \hline 7 & 2018 & 124 \\ \hline 8 & 2018 & 52 \\ \hline 9 & 2019 & 89 & \\ \hline 10 & 2019 & 146 & \\ \hline 11 & 2019 & 205 & \\ \hline 12 & 2019 & 98 & \\ \hline 13 & 2020 & & \\ \hline 14 & 2020 & & \\ \hline 15 & 2020 & & \\ \hline 16 & 2020 & & \\ \hline & & & \\ \hline & slope & & \\ \hline & intercept & \\ \hline \end{tabular} ) Calculate the forecast for 2020 using the Seasonal forecasting method we used in class. Also calculate MAD for this data set. (use 3 decimal places for calculations) (3 \begin{tabular}{|c|c|c|c|c|} \hline & & & & \\ \hline period & Year & Sales & SF & Avesesonalit \\ \hline 1 & 2017 & 73 & \\ \hline 2 & 2017 & 104 \\ \hline 3 & 2017 & 168 \\ \hline 4 & 2017 & 74 \\ \hline 5 & 2018 & 65 \\ \hline 6 & 2018 & 82 \\ \hline 7 & 2018 & 124 \\ \hline 8 & 2018 & 52 \\ \hline 9 & 2019 & 89 & \\ \hline 10 & 2019 & 146 & \\ \hline 11 & 2019 & 205 & \\ \hline 12 & 2019 & 98 & \\ \hline 13 & 2020 & & \\ \hline 14 & 2020 & & \\ \hline 15 & 2020 & & \\ \hline 16 & 2020 & & \\ \hline & & & \\ \hline & slope & & \\ \hline & intercept & \\ \hline \end{tabular}
Step by Step Solution
There are 3 Steps involved in it

Get step-by-step solutions from verified subject matter experts