

Question: ** solve it using excel ** A company has three different products (A, B and C). For Product A, the company sold 200, 100, 150,
** solve it using excel **
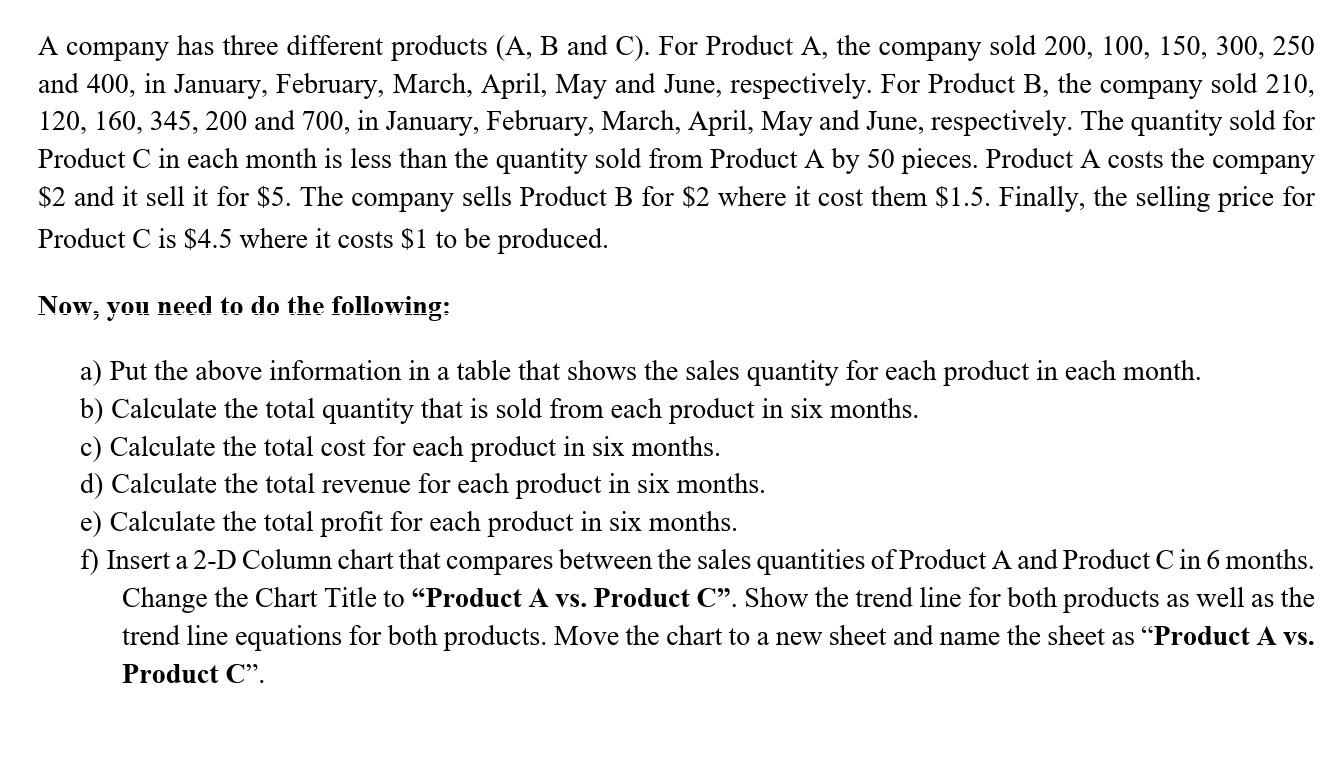
A company has three different products (A, B and C). For Product A, the company sold 200, 100, 150, 300, 250 and 400, in January, February, March, April, May and June, respectively. For Product B, the company sold 210, 120, 160, 345, 200 and 700, in January, February, March, April, May and June, respectively. The quantity sold for Product C in each month is less than the quantity sold from Product A by 50 pieces. Product A costs the company $2 and it sell it for $5. The company sells Product B for $2 where it cost them $1.5. Finally, the selling price for Product C is $4.5 where it costs $1 to be produced. Now, you need to do the following: a) Put the above information in a table that shows the sales quantity for each product in each month. b) Calculate the total quantity that is sold from each product six months. c) Calculate the total cost for each product in six months. d) Calculate the total revenue for each product in six months. e) Calculate the total profit for each product in six months. f) Insert a 2-D Column chart that compares between the sales quantities of Product A and Product C in 6 months. Change the Chart Title to "Product A vs. Product C. Show the trend line for both products as well as the trend line equations for both products. Move the chart to a new sheet and name the sheet as "Product A vs. Product CStep by Step Solution
There are 3 Steps involved in it
1 Expert Approved Answer
Step: 1 Unlock

Question Has Been Solved by an Expert!
Get step-by-step solutions from verified subject matter experts
Step: 2 Unlock
Step: 3 Unlock