

Question: The accompanying data are on flexural data (in MegaPascal, MPa, where 1 Pa (Pascal) = 1.45 x 10⁻⁴ psi). 5.9 7.2 7.3 6.3 8.1
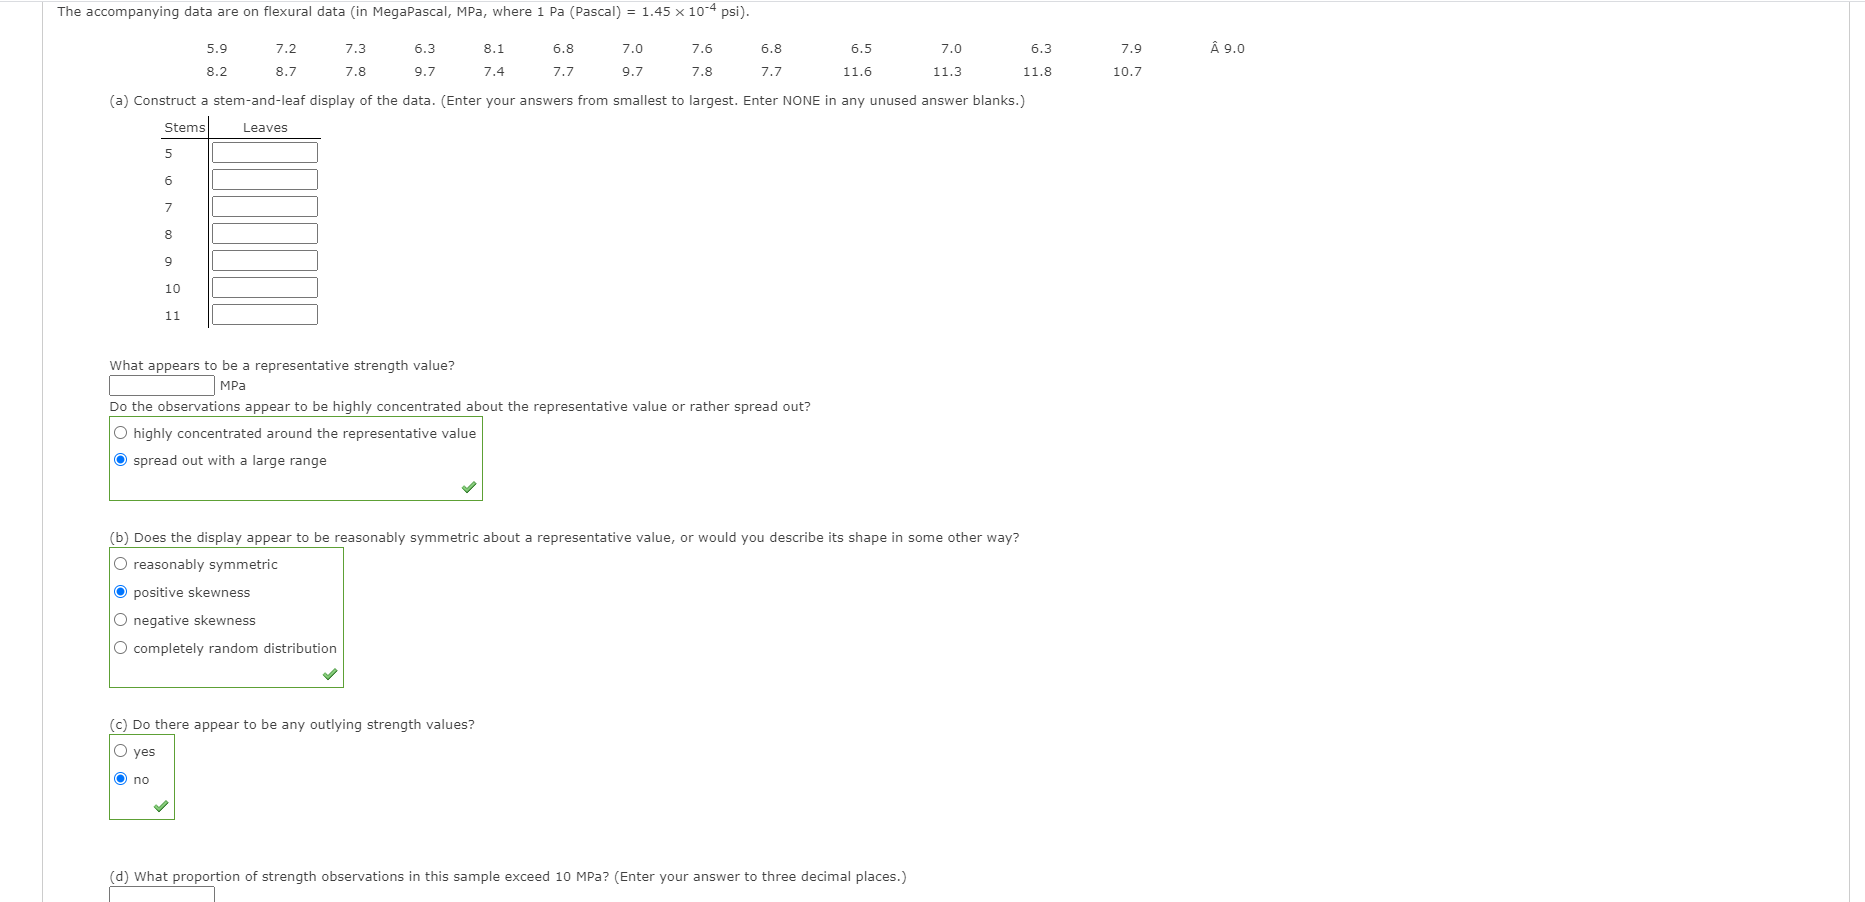
The accompanying data are on flexural data (in MegaPascal, MPa, where 1 Pa (Pascal) = 1.45 x 10⁻⁴ psi). 5.9 7.2 7.3 6.3 8.1 6.8 7.0 7.6 6.8 6.5 7.0 6.3 7.9 9.0 8.2 8.7 7.8 9.7 7.4 7.7 9.7 7.8 7.7 11.6 11.3 11.8 10.7 (a) Construct a stem-and-leaf display of the data. (Enter your answers from smallest to largest. Enter NONE in any unused answer blanks.) Stems Leaves 5 6 7 8 9 10 11 What appears to be a representative strength value? MPa Do the observations appear to be highly concentrated about the representative value or rather spread out? O highly concentrated around the representative value spread out with a large range (b) Does the display appear to be reasonably symmetric about a representative value, or would you describe its shape in some other way? O reasonably symmetric O positive skewness O negative skewness O completely random distribution (c) Do there appear to be any outlying strength values? O yes O no (d) What proportion of strength observations in this sample exceed 10 MPa? (Enter your answer to three decimal places.)
Step by Step Solution
3.49 Rating (159 Votes )
There are 3 Steps involved in it
Step 1 of 4 a Stem and Leaf Display A Stem and Leaf display is a visual representation of the data Steps to construct the stem and leaf chart 1 We ae ... View full answer

Get step-by-step solutions from verified subject matter experts