

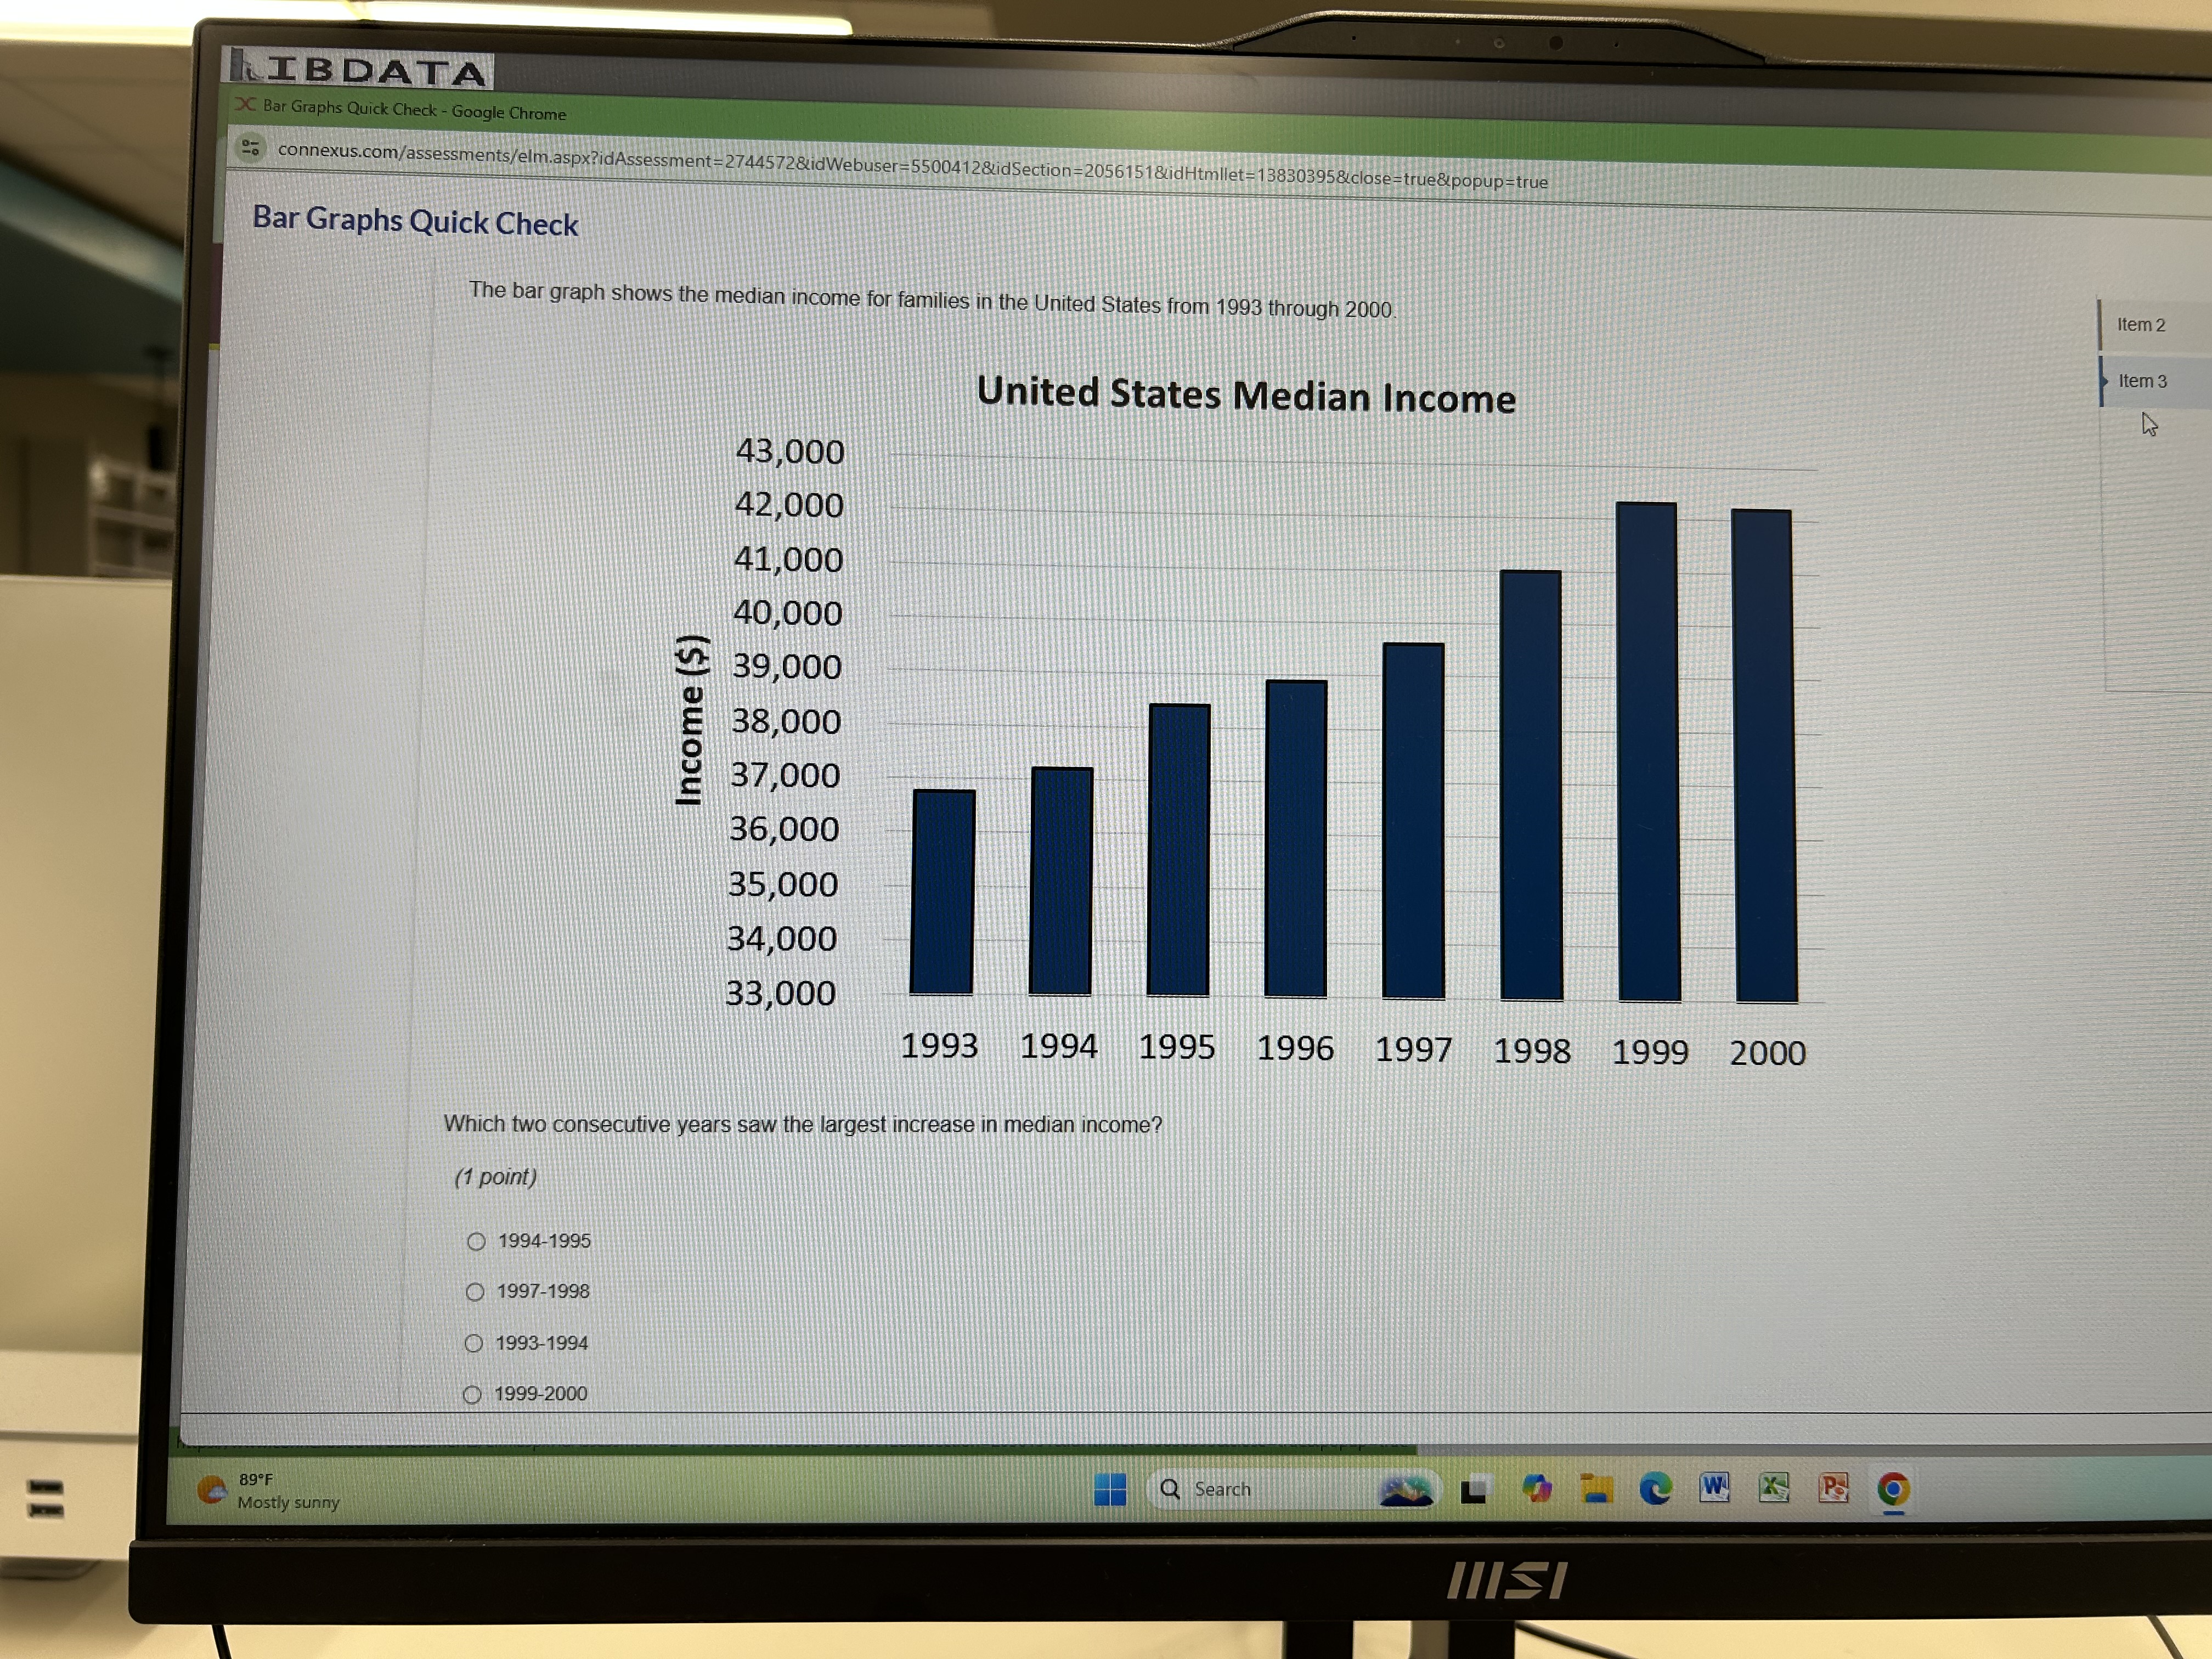
Question: Solve LIBDATA Bar Graphs Quick Check - Google Chrome 2a connexus.com/assessments/elm.aspx?idAssessment=2744572 idWebuser=5500412 idSection=2056151 idHtmllet=13830395 close=true popup=true Bar Graphs Quick Check The bar graph shows the
Solve
 LIBDATA Bar Graphs Quick Check - Google Chrome 2a connexus.com/assessments/elm.aspx?idAssessment=2744572
Step by Step Solution
There are 3 Steps involved in it
1 Expert Approved Answer
Step: 1 Unlock

Question Has Been Solved by an Expert!
Get step-by-step solutions from verified subject matter experts
Step: 2 Unlock
Step: 3 Unlock