

Question: Solve next problem: in this problem you will work with real data, to apply the forecasting concepts you have seen in class. The attached file
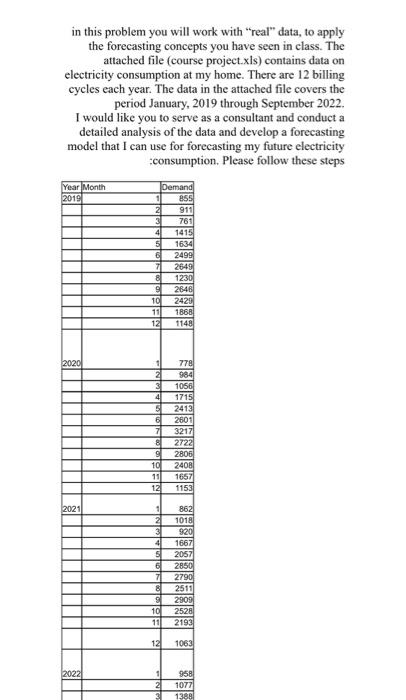
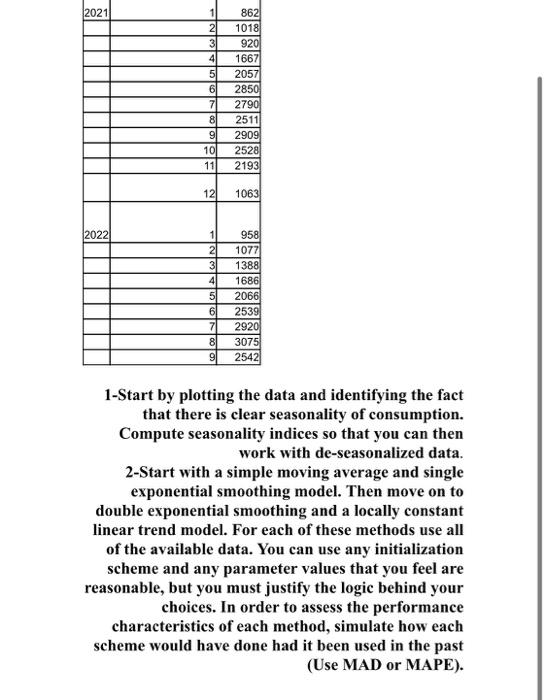
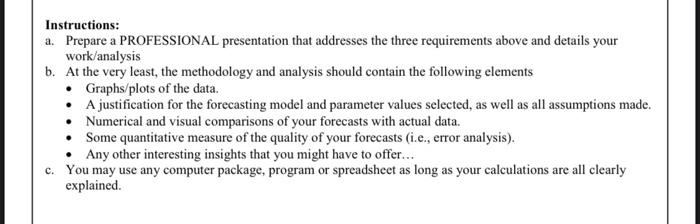
in this problem you will work with "real" data, to apply the forecasting concepts you have seen in class. The attached file (course project.xls) contains data on electricity consumption at my home. There are 12 billing cycles each year. The data in the attached file covers the period January, 2019 through September 2022. is a consultant and conduct a ata and develop a forecasting scasting my future electricity on. Please follow these steps 1-Start by plotting the data and identifying the fact that there is clear seasonality of consumption. Compute seasonality indices so that you can then work with de-seasonalized data. 2-Start with a simple moving average and single exponential smoothing model. Then move on to double exponential smoothing and a locally constant linear trend model. For each of these methods use all of the available data. You can use any initialization scheme and any parameter values that you feel are reasonable, but you must justify the logic behind your choices. In order to assess the performance characteristics of each method, simulate how each scheme would have done had it been used in the past (Use MAD or MAPE). Instructions: a. Prepare a PROFESSIONAL presentation that addresses the three requirements above and details your work/analysis b. At the very least, the methodology and analysis should contain the following elements - Graphs/plots of the data. - A justification for the forecasting model and parameter values selected, as well as all assumptions made - Numerical and visual comparisons of your forecasts with actual data. - Some quantitative measure of the quality of your forecasts (i.e., error analysis). - Any other interesting insights that you might have to offer... c. You may use any computer package, program or spreadsheet as long as your calculations are all clearly explained. in this problem you will work with "real" data, to apply the forecasting concepts you have seen in class. The attached file (course project.xls) contains data on electricity consumption at my home. There are 12 billing cycles each year. The data in the attached file covers the period January, 2019 through September 2022. is a consultant and conduct a ata and develop a forecasting scasting my future electricity on. Please follow these steps 1-Start by plotting the data and identifying the fact that there is clear seasonality of consumption. Compute seasonality indices so that you can then work with de-seasonalized data. 2-Start with a simple moving average and single exponential smoothing model. Then move on to double exponential smoothing and a locally constant linear trend model. For each of these methods use all of the available data. You can use any initialization scheme and any parameter values that you feel are reasonable, but you must justify the logic behind your choices. In order to assess the performance characteristics of each method, simulate how each scheme would have done had it been used in the past (Use MAD or MAPE). Instructions: a. Prepare a PROFESSIONAL presentation that addresses the three requirements above and details your work/analysis b. At the very least, the methodology and analysis should contain the following elements - Graphs/plots of the data. - A justification for the forecasting model and parameter values selected, as well as all assumptions made - Numerical and visual comparisons of your forecasts with actual data. - Some quantitative measure of the quality of your forecasts (i.e., error analysis). - Any other interesting insights that you might have to offer... c. You may use any computer package, program or spreadsheet as long as your calculations are all clearly explained
Step by Step Solution
There are 3 Steps involved in it

Get step-by-step solutions from verified subject matter experts