

Question: I wnat to solve the next: -the data has been provide in the Image: 1-Start by plotting the data and identifying the fact that there
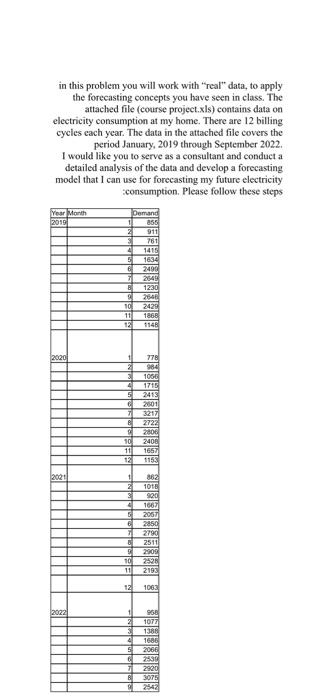
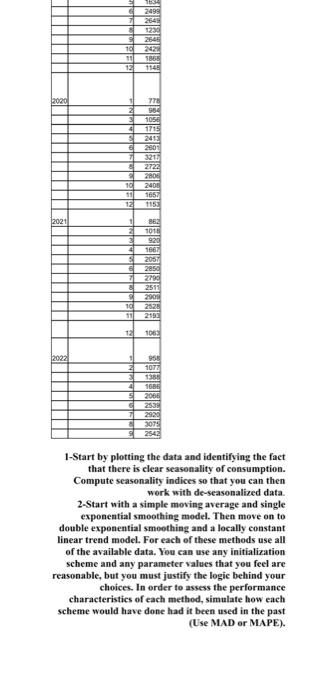
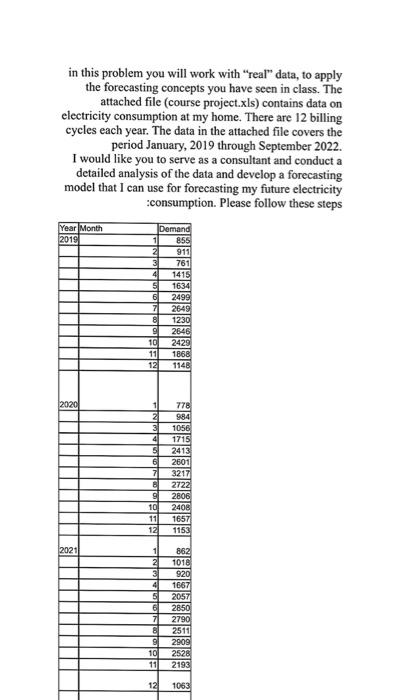
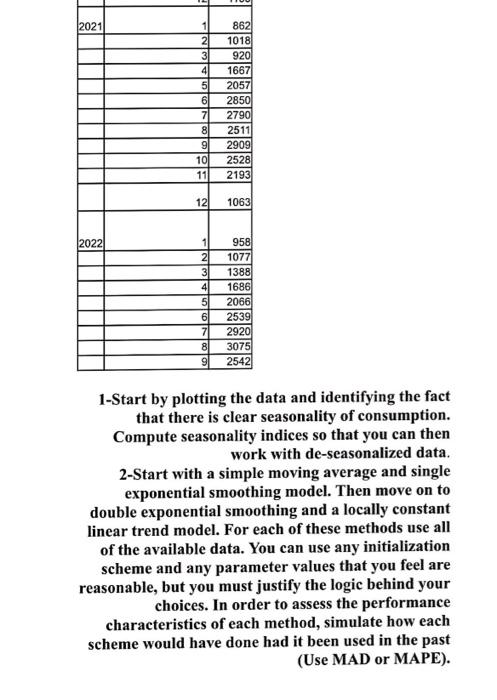
in this problem you will work with "real" data, to apply the forecasting concepts you have seen in class. The attached file (course project.xls) contains data on electricity consumption at my home. There are 12 billing cycles each year. The data in the attached file covers the period January, 2019 through September 2022. I would like you to serve as a consultant and conduct a detailed analysis of the data and develop a forecasting model that 1 can use for forecasting my future electricity iconsumption. Please follow these steps 1-Start by plotting the data and identifying the fact that there is clear seasonality of consumption. Compute seasonality indices so that you can then work with de-seasonalized data. 2-Start with a simple moving average and single exponential smoothing model. Then move on to double exponential smoething and a locally constant linear trend model. For each of these methods use all of the available data. You can use any initialization scheme and any parameter values that you feel are reasonable, but you must justify the logic behind your choices. In order to assess the performance characteristics of each method, simulate how each scheme would have done had it been used in the past (Use M.AD or MLPE). in this problem you will work with "real" data, to apply the forecasting concepts you have seen in class. The attached file (course project.xis) contains data on electricity consumption at my home. There are 12 billing cycles each year. The data in the attached file covers the period January, 2019 through September 2022. I would like you to serve as a consultant and conduct a detailed analysis of the data and develop a forecasting model that I can use for forecasting my future electricity - annewmntion. Please follow these steps 1-Start by plotting the data and identifying the fact that there is clear seasonality of consumption. Compute seasonality indices so that you can then work with de-seasonalized data. 2-Start with a simple moving average and single exponential smoothing model. Then move on to double exponential smoothing and a locally constant linear trend model. For each of these methods use all of the available data. You can use any initialization scheme and any parameter values that you feel are reasonable, but you must justify the logic behind your choices. In order to assess the performance characteristics of each method, simulate how each scheme would have done had it been used in the past (Use MAD or MAPE). in this problem you will work with "real" data, to apply the forecasting concepts you have seen in class. The attached file (course project.xls) contains data on electricity consumption at my home. There are 12 billing cycles each year. The data in the attached file covers the period January, 2019 through September 2022. I would like you to serve as a consultant and conduct a detailed analysis of the data and develop a forecasting model that 1 can use for forecasting my future electricity iconsumption. Please follow these steps 1-Start by plotting the data and identifying the fact that there is clear seasonality of consumption. Compute seasonality indices so that you can then work with de-seasonalized data. 2-Start with a simple moving average and single exponential smoothing model. Then move on to double exponential smoething and a locally constant linear trend model. For each of these methods use all of the available data. You can use any initialization scheme and any parameter values that you feel are reasonable, but you must justify the logic behind your choices. In order to assess the performance characteristics of each method, simulate how each scheme would have done had it been used in the past (Use M.AD or MLPE). in this problem you will work with "real" data, to apply the forecasting concepts you have seen in class. The attached file (course project.xis) contains data on electricity consumption at my home. There are 12 billing cycles each year. The data in the attached file covers the period January, 2019 through September 2022. I would like you to serve as a consultant and conduct a detailed analysis of the data and develop a forecasting model that I can use for forecasting my future electricity - annewmntion. Please follow these steps 1-Start by plotting the data and identifying the fact that there is clear seasonality of consumption. Compute seasonality indices so that you can then work with de-seasonalized data. 2-Start with a simple moving average and single exponential smoothing model. Then move on to double exponential smoothing and a locally constant linear trend model. For each of these methods use all of the available data. You can use any initialization scheme and any parameter values that you feel are reasonable, but you must justify the logic behind your choices. In order to assess the performance characteristics of each method, simulate how each scheme would have done had it been used in the past (Use MAD or MAPE)
Step by Step Solution
There are 3 Steps involved in it

Get step-by-step solutions from verified subject matter experts