

Question: solve on paper please The table below provides the realized annual returns for a stock index during six consecutive years. 2018 2019 24.3% 30% 38.8%
solve on paper please
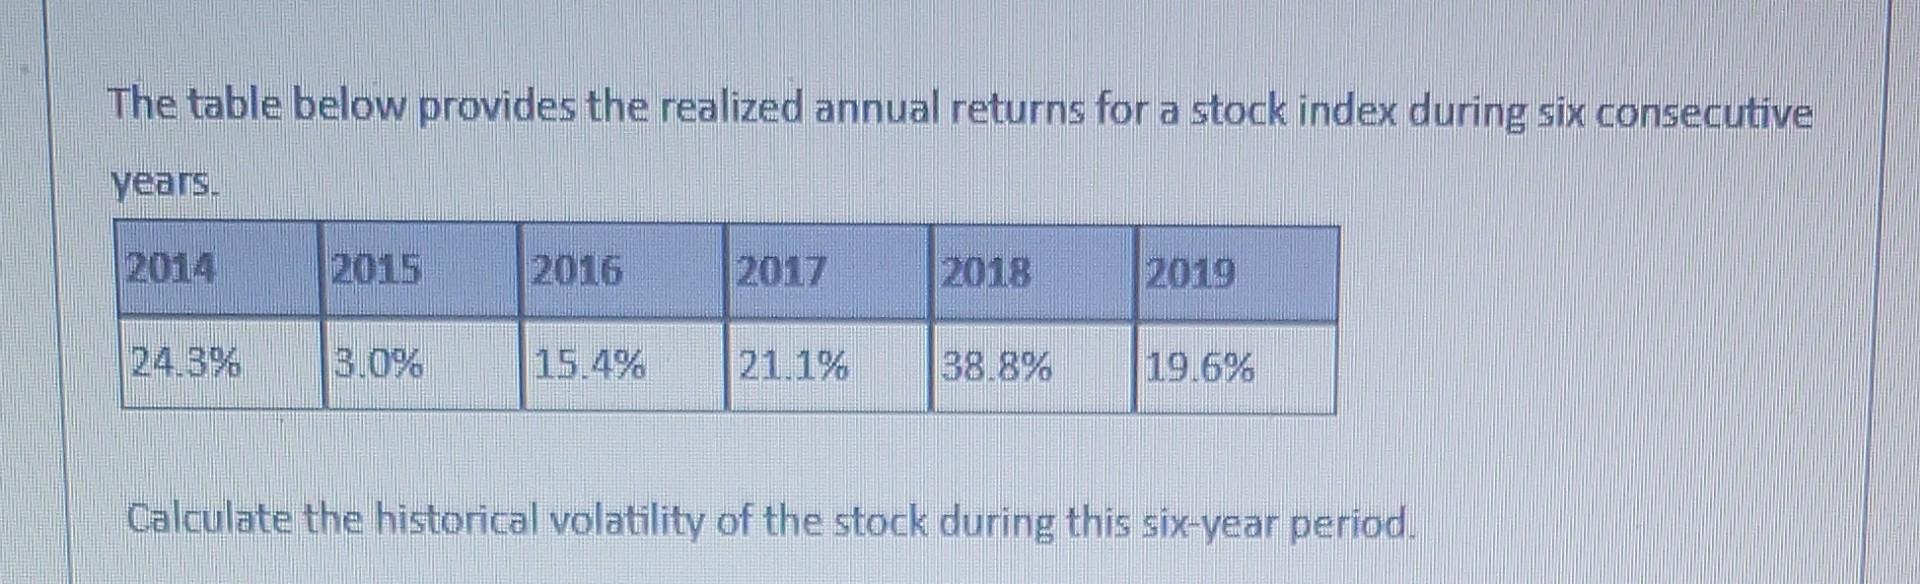
The table below provides the realized annual returns for a stock index during six consecutive years. 2018 2019 24.3% 30% 38.8% 1916% Calculate the historical volatility of the stock during this six-year period
Step by Step Solution
There are 3 Steps involved in it
1 Expert Approved Answer
Step: 1 Unlock

Question Has Been Solved by an Expert!
Get step-by-step solutions from verified subject matter experts
Step: 2 Unlock
Step: 3 Unlock