

Question: Solve please using python and matplotlib.pyplot Answer the following questions: B-1. List all the variables shown in Table 1. What is the use of Table
Solve please using python and matplotlib.pyplot
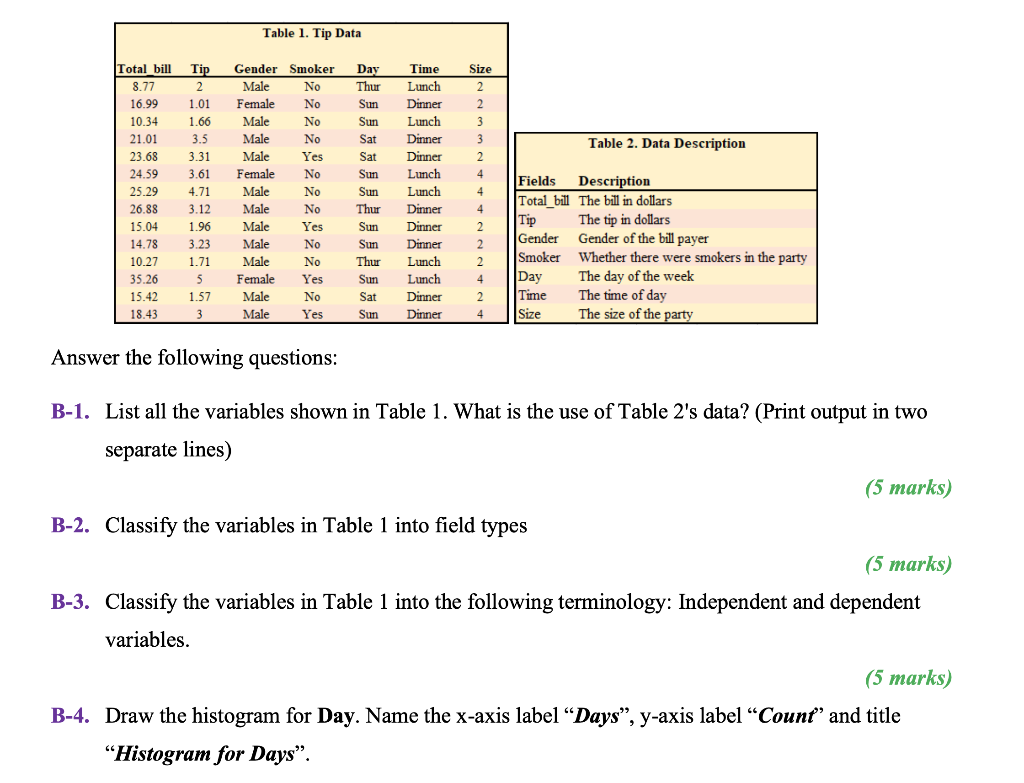
Answer the following questions: B-1. List all the variables shown in Table 1. What is the use of Table 2's data? (Print output in two separate lines) (5 marks) B-2. Classify the variables in Table 1 into field types (5 marks) B-3. Classify the variables in Table 1 into the following terminology: Independent and dependent variables. (5 marks) B-4. Draw the histogram for Day. Name the x-axis label "Days", y-axis label "Count" and title "Histogram for Days
Step by Step Solution
There are 3 Steps involved in it
1 Expert Approved Answer
Step: 1 Unlock

Question Has Been Solved by an Expert!
Get step-by-step solutions from verified subject matter experts
Step: 2 Unlock
Step: 3 Unlock