

Question: solve problem3 Problem 3 Forecast future trip interchanges for the region. Use the trip generation forecast from Problem 1 for future productions and attractions. Utilize
solve problem3 
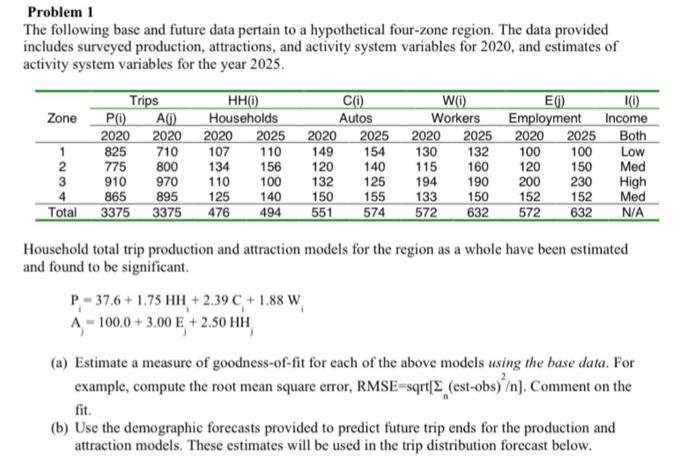
Problem 3 Forecast future trip interchanges for the region. Use the trip generation forecast from Problem 1 for future productions and attractions. Utilize the calibrated friction factors and final matrix column/row factoring Problem 1 The following base and future data pertain to a hypothetical four-zone region. The data provided includes surveyed production, attractions, and activity system variables for 2020, and estimates of activity system variables for the year 2025. CO Zone Trips HHO) PO AC) Households 2020 2020 2020 2025 825 710 107 775 800 134 156 910 970 110 100 865 895 125 140 3375 3375 476 494 110 130 132 WO) EC) 10 Workers Employment Income 2020 2025 2020 2025 Both 100 Low 115 160 120 150 Med 194 190 200 230 High 133 152 Med 572 632 572 632 N/A 1 2 3 100 AWN Autos 2020 2025 149 154 120 140 132 125 150 155 551 574 150 152 Total Household total trip production and attraction models for the region as a whole have been estimated and found to be significant P-37.6+1.75 HH +2.39 C + 1.88 W A - 100.0 +3.00 E + 2.50 HH (a) Estimate a measure of goodness-of-fit for each of the above models using the base data. For example, compute the root mean square error, RMSE-sqrt(3 (est-obs) ). Comment on the fit. (b) Use the demographic forecasts provided to predict future trip ends for the production and attraction models. These estimates will be used in the trip distribution forecast below. Problem 3 Forecast future trip interchanges for the region. Use the trip generation forecast from Problem 1 for future productions and attractions. Utilize the calibrated friction factors and final matrix column/row factoring Problem 1 The following base and future data pertain to a hypothetical four-zone region. The data provided includes surveyed production, attractions, and activity system variables for 2020, and estimates of activity system variables for the year 2025. CO Zone Trips HHO) PO AC) Households 2020 2020 2020 2025 825 710 107 775 800 134 156 910 970 110 100 865 895 125 140 3375 3375 476 494 110 130 132 WO) EC) 10 Workers Employment Income 2020 2025 2020 2025 Both 100 Low 115 160 120 150 Med 194 190 200 230 High 133 152 Med 572 632 572 632 N/A 1 2 3 100 AWN Autos 2020 2025 149 154 120 140 132 125 150 155 551 574 150 152 Total Household total trip production and attraction models for the region as a whole have been estimated and found to be significant P-37.6+1.75 HH +2.39 C + 1.88 W A - 100.0 +3.00 E + 2.50 HH (a) Estimate a measure of goodness-of-fit for each of the above models using the base data. For example, compute the root mean square error, RMSE-sqrt(3 (est-obs) ). Comment on the fit. (b) Use the demographic forecasts provided to predict future trip ends for the production and attraction models. These estimates will be used in the trip distribution forecast below Step by Step Solution
There are 3 Steps involved in it
1 Expert Approved Answer
Step: 1 Unlock

Question Has Been Solved by an Expert!
Get step-by-step solutions from verified subject matter experts
Step: 2 Unlock
Step: 3 Unlock