

Question: solve (Q3 and Q4) Question: 03 The data below represent diagnosis time of ultrasound procedure at outpatient clinic in hours. a. Construct the frequency, relative
solve (Q3 and Q4) 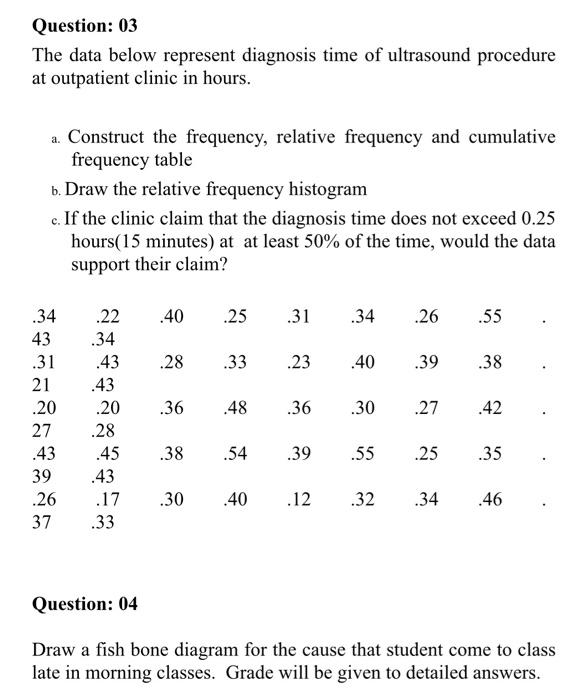
Question: 03 The data below represent diagnosis time of ultrasound procedure at outpatient clinic in hours. a. Construct the frequency, relative frequency and cumulative frequency table b. Draw the relative frequency histogram c. If the clinic claim that the diagnosis time does not exceed 0.25 hours ( 15 minutes) at at least 50% of the time, would the data support their claim? Question: 04 Draw a fish bone diagram for the cause that student come to class late in morning classes. Grade will be given to detailed answers
Step by Step Solution
There are 3 Steps involved in it
1 Expert Approved Answer
Step: 1 Unlock

Question Has Been Solved by an Expert!
Get step-by-step solutions from verified subject matter experts
Step: 2 Unlock
Step: 3 Unlock