

Question: solve question 1 and 2 and please take me through the steps for better understanding 1. Complete the financing portion of Panera Bread Company's 2007
solve question 1 and 2 and please take me through the steps for better understanding
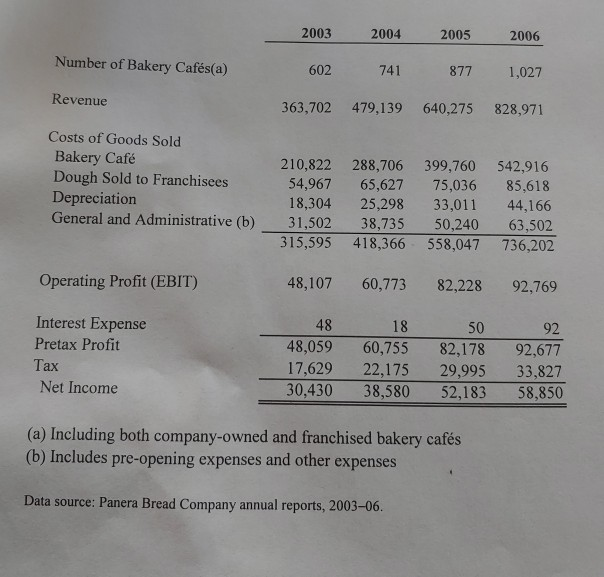
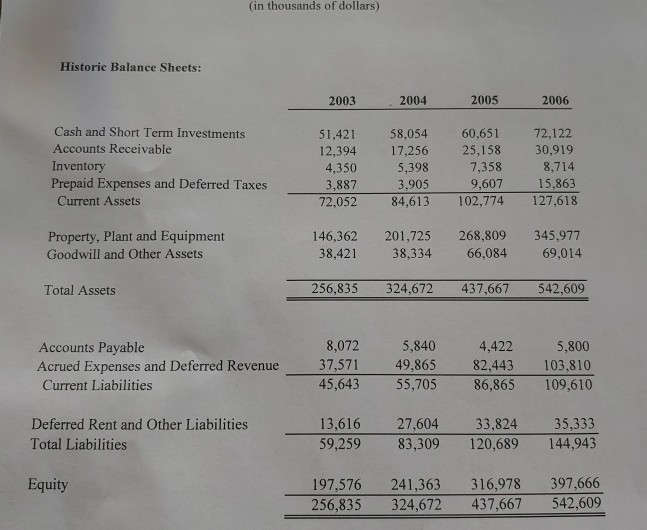
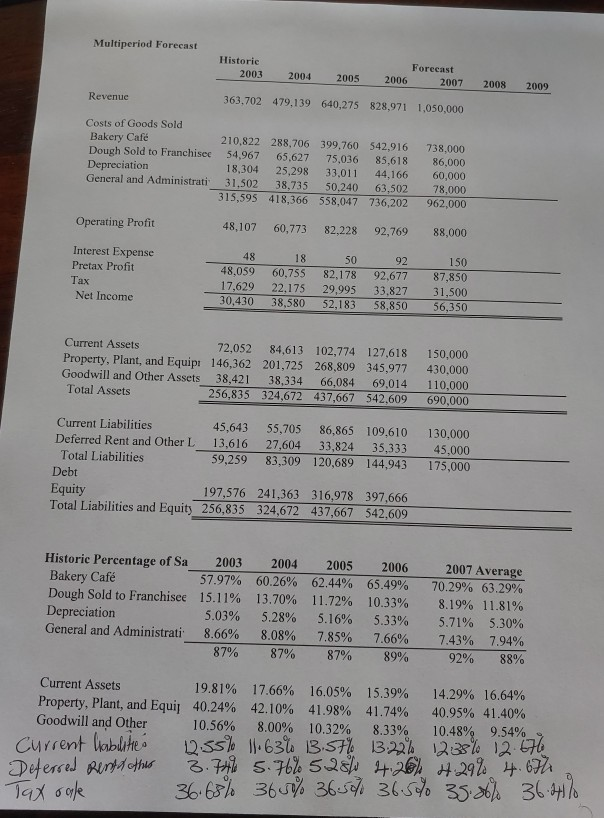
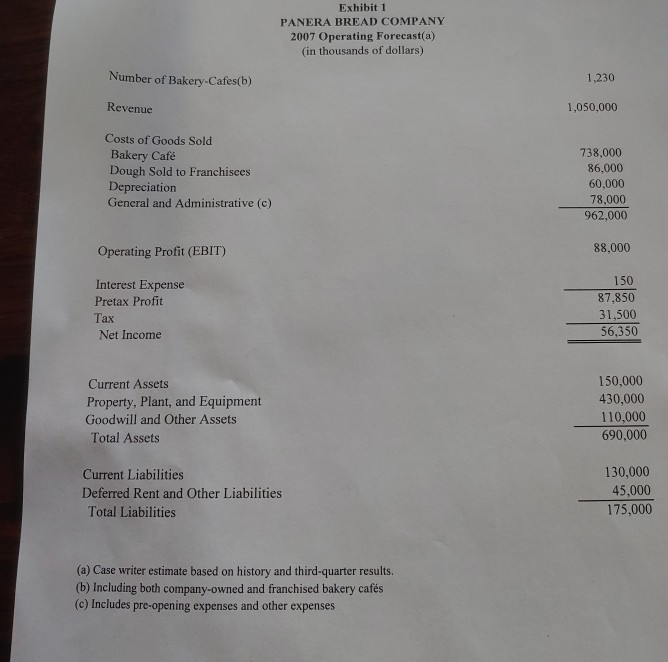
1. Complete the financing portion of Panera Bread Company's 2007 forecast financial statements Include a chart of your financial assumptions. 2. Develop a 5 year Financial Forecast (both Balance Sheet and Income Statement) 3. Describe three possible financial forecasting processes. Discuss the benefits and limitations of each three methods. Describe why you chose the approach you used in this case study. 4. Provide an assessment of the earning quality of Panera Bread in Year 5 of the projected financial statements. 5. Determine the amount of Free Cash Flow Panera has in Year 5 of the projected financial statements. Discuss the importance of Free Cash Flow, and it's relationship to overall accounting earnings 6. Develop a table of relevant financial ratios for 2007 and Forecast Year 5; discuss the ratios, their change of the forecast period, and the overall performance of Panera Bread in Forecast Year 5. 7. Given the need for external sources of capital, compare and contrast the advantages and disadvantages of external equity, a long-term note payable, and a short-term line of credit. Case Study Assumptions: 1. 2. 3. A 5-year financial forecast worksheet has been provided to you on Blackboard. Assume all borrowing are a type of debt, no additional equity will be utilized to raise capital The share repurchase program DOES occur in 2008; and interest expense is equal to 6% of outstanding debt Sales growth is 25% for the first two years, then 5% thereafter. 4 2003 2004 2005 2006 Number of Bakery Cafs(a) 602 741 877 1,027 Revenue 363,702 479,139 640,275 828,971 Costs of Goods Sold Bakery Caf Dough Sold to Franchisees Depreciation General and Administrative (b) 210,822 288,706 399,760 542,916 54,967 65,627 75,036 85.618 18,304 25,298 33,011 44,166 31,502 38,735 50,240 63,502 315,595 418,366 558,047 736,202 Operating Profit (EBIT) 48,107 60,773 82,228 92,769 Interest Expense Pretax Profit Tax Net Income 48 48,059 17,629 30,430 18 60,755 22,175 38,580 50 82,178 29,995 52,183 92 92,677 33,827 58,850 (a) Including both company-owned and franchised bakery cafs (b) Includes pre-opening expenses and other expenses Data source: Panera Bread Company annual reports, 2003-06. (in thousands of dollars) Historic Balance Sheets: 2003 2004 2005 2006 Cash and Short Term Investments Accounts Receivable Inventory Prepaid Expenses and Deferred Taxes Current Assets 51,421 12,394 4,350 3,887 72,052 58.054 17,256 5,398 3,905 84,613 60,651 25,158 7,358 9,607 102,774 72,122 30,919 8,714 15,863 127,618 Property, Plant and Equipment Goodwill and Other Assets 146,362 38,421 201,725 38,334 268,809 66,084 345,977 69,014 Total Assets 256,835 324,672 437,667 542,609 Accounts Payable Acrued Expenses and Deferred Revenue Current Liabilities 8,072 37,571 45,643 5,840 49,865 55,705 4,422 82,443 86,865 5,800 103,810 109,610 Deferred Rent and Other Liabilities Total Liabilities 13,616 59,259 27,604 83,309 33,824 120,689 35,333 144,943 Equity 197,576 256,835 241,363 324,672 316,978 437,667 397,666 542,609 Multiperiod Forecast Historic 2003 2004 2005 Forecast 2006 2007 2008 2009 Revenue 363,702 479,139 640,275 828,971 1,050,000 Costs of Goods Sold Bakery Cafe Dough Sold to Franchisec Depreciation General and Administrati 210.822 288,706 399,760 542,916 54,967 65,627 75,036 85,618 18,304 25,298 33.011 44,166 31,502 38,735 50,240 63,502 315,595 418,366 558,047 736,202 738.000 86,000 60,000 78,000 962,000 Operating Profit 48,107 60,773 82,228 92,769 88,000 Interest Expense Pretax Profit Tax Net Income 48 48,059 17,629 30,430 18 60.755 22.175 38,580 50 82,178 29,995 52,183 92 92,677 33.827 58,850 150 87,850 31,500 56,350 Current Assets 72,052 84.613 102,774 127.618 Property, Plant, and Equip 146,362 201,725 268,809 345,977 Goodwill and Other Assets 38,421 38,334 66,084 69,014 Total Assets 256,835 324,672 437,667 542,609 150,000 430.000 110,000 690,000 Current Liabilities 45,643 55,705 86,865 109.610 Deferred Rent and Other L 13,616 27,604 33,824 35,333 Total Liabilities 59,259 83,309 120,689 144,943 Debt Equity 197,576 241,363 316,978 397,666 Total Liabilities and Equity 256,835 324,672 437,667 542,609 130,000 45,000 175,000 Historic Percentage of Sa 2003 2004 2005 2006 Bakery Caf 57.97% 60.26% 62.44% 65.49% Dough Sold to Franchisee 15.11% 13.70% 11.72% 10.33% Depreciation 5.03% 5.28% 5.16% 5.33% General and Administrati 8.66% 8.08% 7.85% 7.66% 87% 87% 87% 89% 2007 Average 70.29% 63.29% 8.19% 11.81% 5.71% 5.30% 7.43% 7.94% 92% 88% Current Assets 19.81% 17.66% 16.05% 15.39% 14.29% 16.64% Property, Plant, and Equip 40.24% 42.10% 41.98% 41.74% 40.95% 41.40% Goodwill and Other 10.56% 8.00% 10.32% 8.33% 10.48% 9.54% Current habilities 2.55% 63% 3.57% 13:22% 238% 12.676 Deferred Rend this 3.74 5.76% 5280 4.26% 4.29% 4.6th Tax ogle 365% 36.500 36.5% 35.86% 36.63% 36.97% Exhibit 1 PANERA BREAD COMPANY 2007 Operating Forecast(a) (in thousands of dollars) Number of Bakery-Cafes(b) 1,230 Revenue 1,050,000 Costs of Goods Sold Bakery Caf Dough Sold to Franchisees Depreciation General and Administrative (c) 738,000 86.000 60.000 78,000 962,000 Operating Profit (EBIT) 88,000 Interest Expense Pretax Profit Tax Net Income 150 87,850 31,500 56,350 Current Assets Property, Plant, and Equipment Goodwill and Other Assets Total Assets 150,000 430,000 110,000 690,000 Current Liabilities Deferred Rent and Other Liabilities Total Liabilities 130,000 45,000 175,000 (a) Case writer estimate based on history and third-quarter results. (b) Including both company-owned and franchised bakery cafs (c) Includes pre-opening expenses and other expenses 1. Complete the financing portion of Panera Bread Company's 2007 forecast financial statements Include a chart of your financial assumptions. 2. Develop a 5 year Financial Forecast (both Balance Sheet and Income Statement) 3. Describe three possible financial forecasting processes. Discuss the benefits and limitations of each three methods. Describe why you chose the approach you used in this case study. 4. Provide an assessment of the earning quality of Panera Bread in Year 5 of the projected financial statements. 5. Determine the amount of Free Cash Flow Panera has in Year 5 of the projected financial statements. Discuss the importance of Free Cash Flow, and it's relationship to overall accounting earnings 6. Develop a table of relevant financial ratios for 2007 and Forecast Year 5; discuss the ratios, their change of the forecast period, and the overall performance of Panera Bread in Forecast Year 5. 7. Given the need for external sources of capital, compare and contrast the advantages and disadvantages of external equity, a long-term note payable, and a short-term line of credit. Case Study Assumptions: 1. 2. 3. A 5-year financial forecast worksheet has been provided to you on Blackboard. Assume all borrowing are a type of debt, no additional equity will be utilized to raise capital The share repurchase program DOES occur in 2008; and interest expense is equal to 6% of outstanding debt Sales growth is 25% for the first two years, then 5% thereafter. 4 2003 2004 2005 2006 Number of Bakery Cafs(a) 602 741 877 1,027 Revenue 363,702 479,139 640,275 828,971 Costs of Goods Sold Bakery Caf Dough Sold to Franchisees Depreciation General and Administrative (b) 210,822 288,706 399,760 542,916 54,967 65,627 75,036 85.618 18,304 25,298 33,011 44,166 31,502 38,735 50,240 63,502 315,595 418,366 558,047 736,202 Operating Profit (EBIT) 48,107 60,773 82,228 92,769 Interest Expense Pretax Profit Tax Net Income 48 48,059 17,629 30,430 18 60,755 22,175 38,580 50 82,178 29,995 52,183 92 92,677 33,827 58,850 (a) Including both company-owned and franchised bakery cafs (b) Includes pre-opening expenses and other expenses Data source: Panera Bread Company annual reports, 2003-06. (in thousands of dollars) Historic Balance Sheets: 2003 2004 2005 2006 Cash and Short Term Investments Accounts Receivable Inventory Prepaid Expenses and Deferred Taxes Current Assets 51,421 12,394 4,350 3,887 72,052 58.054 17,256 5,398 3,905 84,613 60,651 25,158 7,358 9,607 102,774 72,122 30,919 8,714 15,863 127,618 Property, Plant and Equipment Goodwill and Other Assets 146,362 38,421 201,725 38,334 268,809 66,084 345,977 69,014 Total Assets 256,835 324,672 437,667 542,609 Accounts Payable Acrued Expenses and Deferred Revenue Current Liabilities 8,072 37,571 45,643 5,840 49,865 55,705 4,422 82,443 86,865 5,800 103,810 109,610 Deferred Rent and Other Liabilities Total Liabilities 13,616 59,259 27,604 83,309 33,824 120,689 35,333 144,943 Equity 197,576 256,835 241,363 324,672 316,978 437,667 397,666 542,609 Multiperiod Forecast Historic 2003 2004 2005 Forecast 2006 2007 2008 2009 Revenue 363,702 479,139 640,275 828,971 1,050,000 Costs of Goods Sold Bakery Cafe Dough Sold to Franchisec Depreciation General and Administrati 210.822 288,706 399,760 542,916 54,967 65,627 75,036 85,618 18,304 25,298 33.011 44,166 31,502 38,735 50,240 63,502 315,595 418,366 558,047 736,202 738.000 86,000 60,000 78,000 962,000 Operating Profit 48,107 60,773 82,228 92,769 88,000 Interest Expense Pretax Profit Tax Net Income 48 48,059 17,629 30,430 18 60.755 22.175 38,580 50 82,178 29,995 52,183 92 92,677 33.827 58,850 150 87,850 31,500 56,350 Current Assets 72,052 84.613 102,774 127.618 Property, Plant, and Equip 146,362 201,725 268,809 345,977 Goodwill and Other Assets 38,421 38,334 66,084 69,014 Total Assets 256,835 324,672 437,667 542,609 150,000 430.000 110,000 690,000 Current Liabilities 45,643 55,705 86,865 109.610 Deferred Rent and Other L 13,616 27,604 33,824 35,333 Total Liabilities 59,259 83,309 120,689 144,943 Debt Equity 197,576 241,363 316,978 397,666 Total Liabilities and Equity 256,835 324,672 437,667 542,609 130,000 45,000 175,000 Historic Percentage of Sa 2003 2004 2005 2006 Bakery Caf 57.97% 60.26% 62.44% 65.49% Dough Sold to Franchisee 15.11% 13.70% 11.72% 10.33% Depreciation 5.03% 5.28% 5.16% 5.33% General and Administrati 8.66% 8.08% 7.85% 7.66% 87% 87% 87% 89% 2007 Average 70.29% 63.29% 8.19% 11.81% 5.71% 5.30% 7.43% 7.94% 92% 88% Current Assets 19.81% 17.66% 16.05% 15.39% 14.29% 16.64% Property, Plant, and Equip 40.24% 42.10% 41.98% 41.74% 40.95% 41.40% Goodwill and Other 10.56% 8.00% 10.32% 8.33% 10.48% 9.54% Current habilities 2.55% 63% 3.57% 13:22% 238% 12.676 Deferred Rend this 3.74 5.76% 5280 4.26% 4.29% 4.6th Tax ogle 365% 36.500 36.5% 35.86% 36.63% 36.97% Exhibit 1 PANERA BREAD COMPANY 2007 Operating Forecast(a) (in thousands of dollars) Number of Bakery-Cafes(b) 1,230 Revenue 1,050,000 Costs of Goods Sold Bakery Caf Dough Sold to Franchisees Depreciation General and Administrative (c) 738,000 86.000 60.000 78,000 962,000 Operating Profit (EBIT) 88,000 Interest Expense Pretax Profit Tax Net Income 150 87,850 31,500 56,350 Current Assets Property, Plant, and Equipment Goodwill and Other Assets Total Assets 150,000 430,000 110,000 690,000 Current Liabilities Deferred Rent and Other Liabilities Total Liabilities 130,000 45,000 175,000 (a) Case writer estimate based on history and third-quarter results. (b) Including both company-owned and franchised bakery cafs (c) Includes pre-opening expenses and other expenses
Step by Step Solution
There are 3 Steps involved in it

Get step-by-step solutions from verified subject matter experts