

Question: Solve step by step with all the explanations using EXCEL SOLVER and fill in the table please FCC Furniture Company manufactures and assembles chairs, tables,
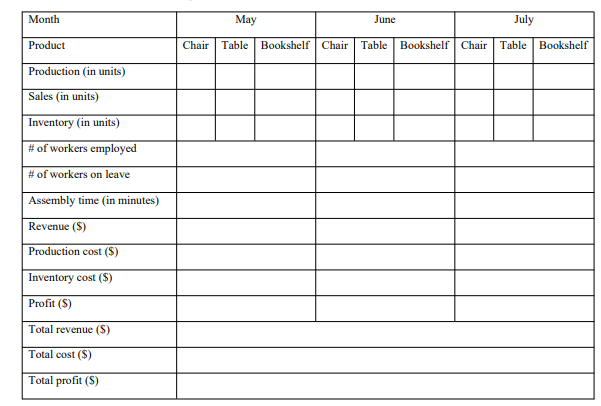
Solve step by step with all the explanations using EXCEL SOLVER and fill in the table please
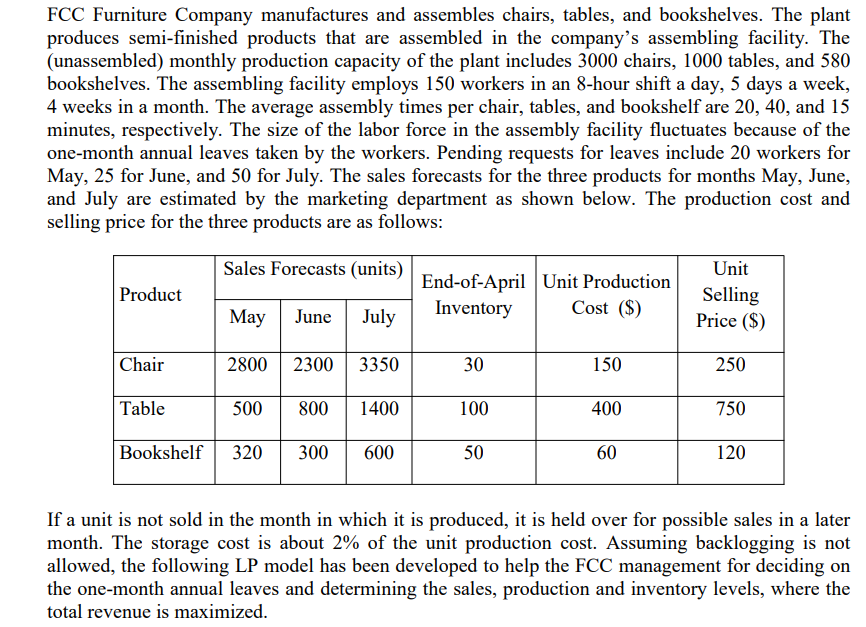
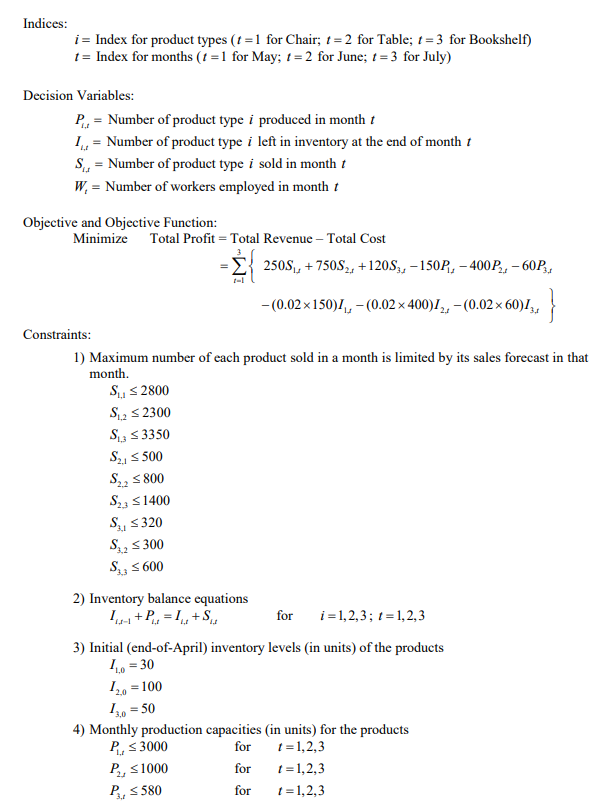
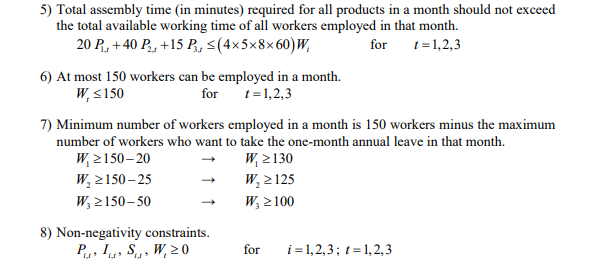
FCC Furniture Company manufactures and assembles chairs, tables, and bookshelves. The plant produces semi-finished products that are assembled in the company's assembling facility. The (unassembled) monthly production capacity of the plant includes 3000 chairs, 1000 tables, and 580 bookshelves. The assembling facility employs 150 workers in an 8-hour shift a day, 5 days a week, 4 weeks in a month. The average assembly times per chair, tables, and bookshelf are 20,40 , and 15 minutes, respectively. The size of the labor force in the assembly facility fluctuates because of the one-month annual leaves taken by the workers. Pending requests for leaves include 20 workers for May, 25 for June, and 50 for July. The sales forecasts for the three products for months May, June, and July are estimated by the marketing department as shown below. The production cost and selling price for the three products are as follows: If a unit is not sold in the month in which it is produced, it is held over for possible sales in a later month. The storage cost is about 2% of the unit production cost. Assuming backlogging is not allowed, the following LP model has been developed to help the FCC management for deciding on the one-month annual leaves and determining the sales, production and inventory levels, where the total revenue is maximized. Indices: i= Index for product types ( t=1 for Chair; t=2 for Table; t=3 for Bookshelf) t= Index for months ( t=1 for May; t=2 for June; t=3 for July) Decision Variables: Pi,t= Number of product type i produced in month t Ii,t= Number of product type i left in inventory at the end of month t Si,t= Number of product type i sold in month t Wt= Number of workers employed in month t Objective and Objective Function: MinimizeTotalProfit==TotalRevenueTotalCostt=13{250S1,t+750S2,t+120S3,t150P1,t400P2,t60P3,t(0.02150)I1,t(0.02400)I2,t(0.0260)I3,t}} Constraints: 1) Maximum number of each product sold in a month is limited by its sales forecast in that month. S1,12800S1,22300S1,33350S2,1500S2,2800S2,31400S3,1320S3,2300S3,3600 2) Inventory balance equations Ii,t1+Pi,t=Ii,t+Si,tfori=1,2,3;t=1,2,3 3) Initial (end-of-April) inventory levels (in units) of the products I1,0=30I2,0=100I3,0=50 4) Monthly production capacities (in units) for the products P1,t3000P2,t1000P3,t580forforfort=1,2,3t=1,2,3t=1,2,3 5) Total assembly time (in minutes) required for all products in a month should not exceed the total available working time of all workers employed in that month. 20P1,t+40P2,t+15P3,t(45860)Wifort=1,2,3 6) At most 150 workers can be employed in a month. Wt150fort=1,2,3 7) Minimum number of workers employed in a month is 150 workers minus the maximum number of workers who want to take the one-month annual leave in that month. W115020W215025W315050W1130W2125W3100 8) Non-negativity constraints. Pi,t,Ii,t,Si,t,Wt0fori=1,2,3;t=1,2,3 \begin{tabular}{|l|l|l|l|l|l|l|l|l|l|} \hline Month & \multicolumn{2}{|c|}{ May } & \multicolumn{2}{c|}{ June } & \multicolumn{2}{c|}{ July } \\ \hline Product & Chair & Table & Bookshelf & Chair & Table & Bookshelf & Chair & Table & Bookshelf \\ \hline Production (in units) & & & & & & & & & \\ \hline Sales (in units) & & & & & & & & & \\ \hline Inventory (in units) & & & & & & & & & \\ \hline \# of workers employed & & & & & & \\ \hline \# of workers on leave & & & & & \\ \hline Assembly time (in minutes) & & & & & \\ \hline Revenue (\$) & & & & & \\ \hline Production cost (\$) & & & & \\ \hline Inventory cost (\$) & & & & \\ \hline Profit (\$) & & & & \\ \hline Total revenue (\$) & & & & \\ \hline Total cost (\$) & & & & \\ \hline Total profit (\$) & & & & \\ \hline \end{tabular}
Step by Step Solution
There are 3 Steps involved in it

Get step-by-step solutions from verified subject matter experts