

Question: Solve the following: 1. The data shown below are the deviations. The values reported are deviations from nominal in ten thousandths of an inch.
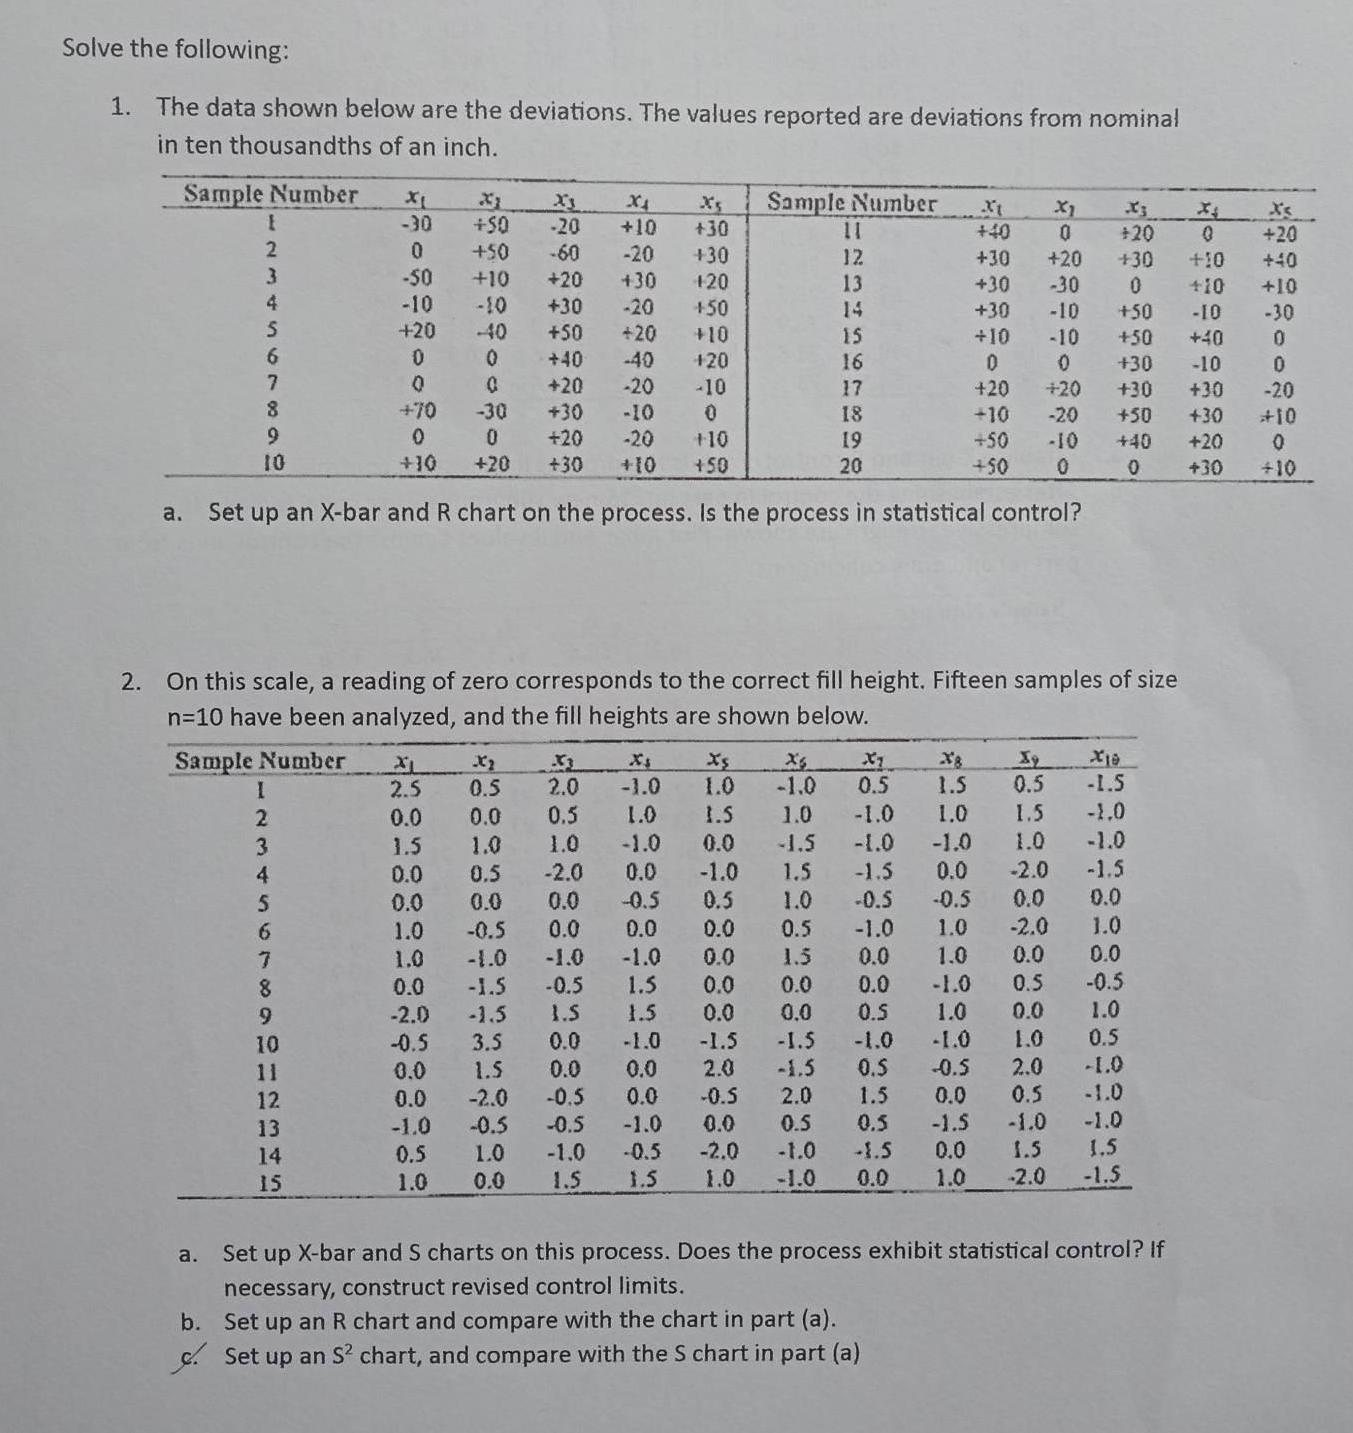
Solve the following: 1. The data shown below are the deviations. The values reported are deviations from nominal in ten thousandths of an inch. Sample Number XI -30 +50 -20 0 +50 -60 -20 -50 +10 +20 +30 -10 -10 +30 -20 +50 +20 -40 +50 +20 +10 0 0 +40 -40 +20 0 0 +20 -20 -10 +70 -30 +30 -10 0 0 +10 0 +20 -20 +10 +20 +30 +10 +50 a. Set up an X-bar and R chart on the process. Is the process in statistical control? I 2 3 4 5 6 7 8 9 10 I 2 3 4 5 6 7 8 9 10 11 12 13 14 15 X 2.5 0.0 1.5 0.0 1.0 1.0 X +10 1.0 -2.0 Sample Number 11 12 +30 +30 +20 X Xs 0.5 33 2.0 -1.0 1.0 -1.0 0.0 0.5 1.0 1.5 1.0 1.0 0.5 0.0 0.0 -0.5 -0.5 0.0 0.0 -1.0 -1.0 -1.0 0.0 -1.5 -0.5 1.5 -2.0 -1.5 1.S 1.5 -0.5 3.5 0.0 -1.0 0.0 1.5 0.0 0.0 0.0 -2.0 -0.5 0.0 -1.0 -0.5 -0.5 -1.0 0.5 1.0 1.0 0.0 -1.0 1.5 13 14 15 16 17 18 19 20 2. On this scale, a reading of zero corresponds to the correct fill height. Fifteen samples of size n=10 have been analyzed, and the fill heights are shown below. Sample Number X1 0 +20 +30 -30 +30 -10 +10 -10 0 0 420 +20 +10 -20 +50 -10 +50 0 +40 +30 +20 +30 0 +50 +50 +30 +30 +30 X10 -1.5 -1.0 -1.0 -1.5 X1 0.5 1.5 0.5 -1.0 1.0 1.5 -1.0 -1.0 1.0 -1.0 0.0 -1.5 0.0 -1.0 1.5 -1.5 0.0 -2.0 0.5 1.0 -0.5 -0.5 0.0 0.0 0.5 -1.0 1.0 -2.0 1.0 0.0 1.5 0.0 1.0 0.0 0.0 0.0 0.0 0.0 -1.0 0.5 -0.5 0.0 0.0 0.5 1.0 0.0 1.0 -1.5 -1.5 -1.0 -1.0 1.0 2.0 -1.5 0.5 -0.5 2.0 -0.5 2.0 0.0 0.5 0.0 1.5 0.5 0.5 -1.0 -1.5 -1.5 -1.0 -0.5 -2.0 0.0 1.5 1.5 1.0 -1.0 0.0 1.0 -2.0 +50 +30 +40 +20 0 +30 0 +10 +10 -10 0.5 -1.0 -1.0 -1.0 1.5 -1.5 a. Set up X-bar and S charts on this process. Does the process exhibit statistical control? If necessary, construct revised control limits. b. Set up an R chart and compare with the chart in part (a). Set up an S chart, and compare with the S chart in part (a) +40 -10 X's +20 +40 +10 -30 0 0 -20 +10 0 +10
Step by Step Solution
3.42 Rating (165 Votes )
There are 3 Steps involved in it
To set up an Xbar and R chart on the process we need to calculate the sample means and ranges a Xbar ... View full answer

Get step-by-step solutions from verified subject matter experts