

Question: Solve the following linear programming models graphically, AND answer the following questions for each model: - Shade the feasible region. - What are the extreme
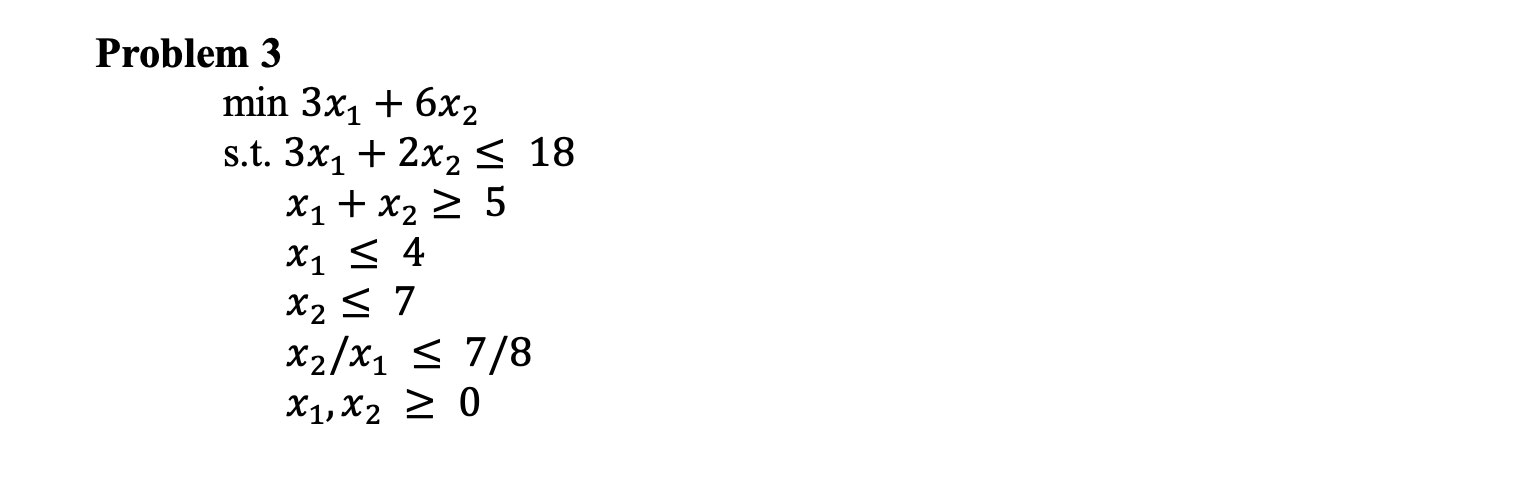
Solve the following linear programming models graphically, AND answer the following questions for each model: - Shade the feasible region. - What are the extreme points? Give their (x1,x2)-coordinates. - Plot the objective function on the graph to demonstrate where it is optimized. - What is the optimal solution? - What is the objective function value at the optimal solution? Problem 3 min3x1+6x2s.t.3x1+2x218x1+x25x14x27x2/x17/8x1,x20
Step by Step Solution
There are 3 Steps involved in it
1 Expert Approved Answer
Step: 1 Unlock

Question Has Been Solved by an Expert!
Get step-by-step solutions from verified subject matter experts
Step: 2 Unlock
Step: 3 Unlock