

Question: Solve the following LP using the graphical method. Clearly show all constraints, the feasible region, at least two iso - profit lines and the point
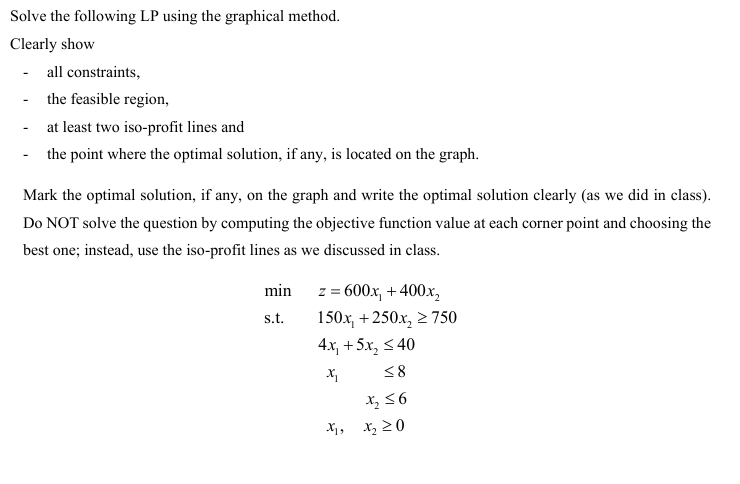
Solve the following LP using the graphical method.
Clearly show
all constraints,
the feasible region,
at least two isoprofit lines and
the point where the optimal solution, if any, is located on the graph.
Mark the optimal solution, if any, on the graph and write the optimal solution clearly as we did in class
Do NOT solve the question by computing the objective function value at each corner point and choosing the
best one; instead, use the isoprofit lines as we discussed in class.
min,
Step by Step Solution
There are 3 Steps involved in it
1 Expert Approved Answer
Step: 1 Unlock

Question Has Been Solved by an Expert!
Get step-by-step solutions from verified subject matter experts
Step: 2 Unlock
Step: 3 Unlock