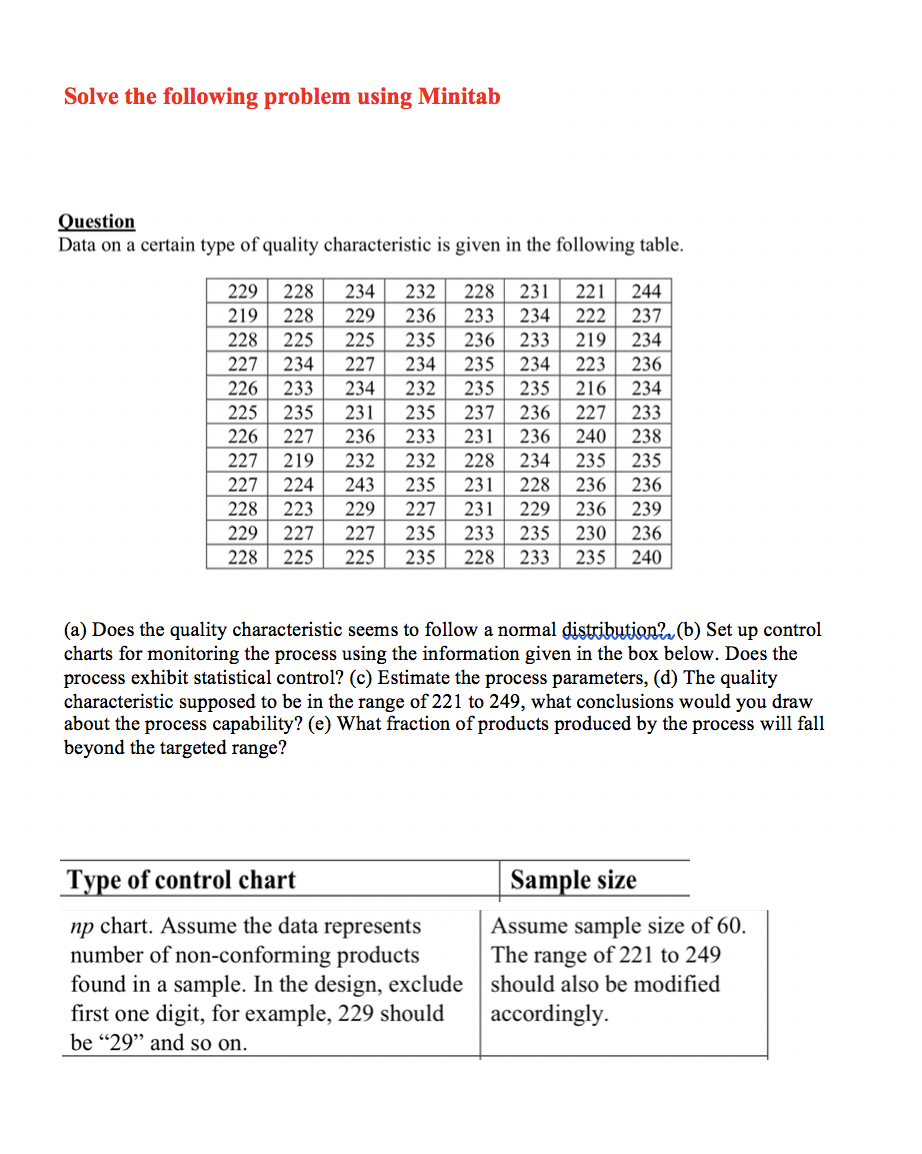
Question: Solve the following problem using Minitab Question Data on a certain type of quality characteristic is given in the following table. 229 | 219 |

Solve the following problem using Minitab

Solve the following problem using Minitab Question Data on a certain type of quality characteristic is given in the following table. 229 | 219 | 228 227 226 225 226 227 227 | 228 229 228 228 228 225 234 233 235 227 219 224 223 227 225 234 229 225 227 234 231 236 232 243 229 227 225 232 236 235 234 232 235 233 232 235 227 235 235 228 233 236 235 235 237 231 228 231 231 233 228 231 234 233 234 235 236 236 234 228 229 235 233 221 244 222 237 219 234 223 236 216 234 227 233 240 238 235 235 236 236 236 239 230 236 235 240 (a) Does the quality characteristic seems to follow a normal distribution?. (b) Set up control charts for monitoring the process using the information given in the box below. Does the process exhibit statistical control? (c) Estimate the process parameters, (d) The quality characteristic supposed to be in the range of 221 to 249, what conclusions would you draw about the process capability? (e) What fraction of products produced by the process will fall beyond the targeted range? Type of control chart Sample size np chart. Assume the data represents Assume sample size of 60. number of non-conforming products The range of 221 to 249 found in a sample. In the design, exclude should also be modified first one digit, for example, 229 should I accordingly. be "29" and so on

Step by Step Solution

There are 3 Steps involved in it

1 Expert Approved Answer
Step: 1 Unlock blur-text-image
Question Has Been Solved by an Expert!

Get step-by-step solutions from verified subject matter experts

Step: 2 Unlock
Step: 3 Unlock

Students Have Also Explored These Related General Management Questions!