

Question: Solve the following question Compute the sample variance and standard deviation for the water absorbency data of Exercise 1.2 on page 13. Reference: Exercise 1.2
Solve the following question
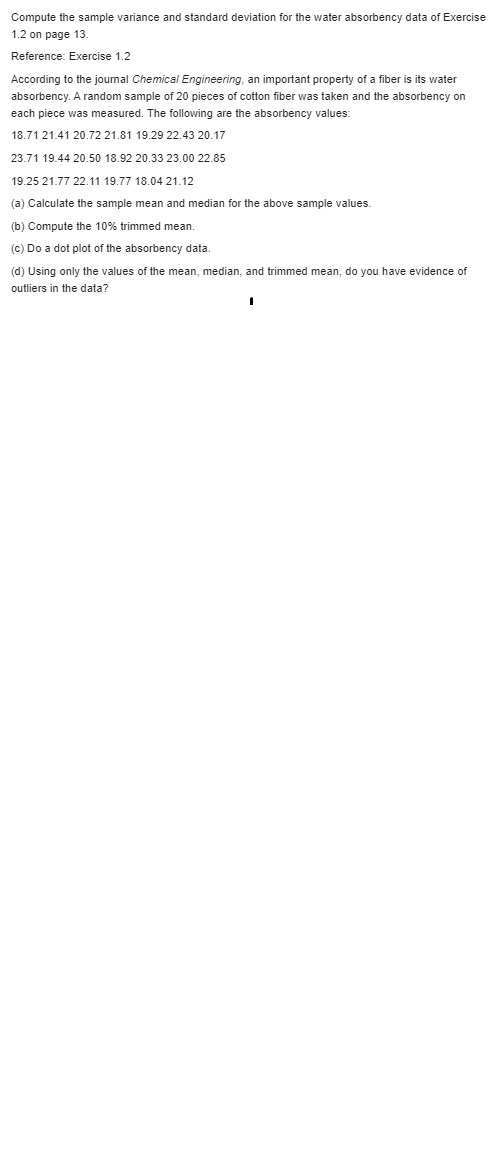
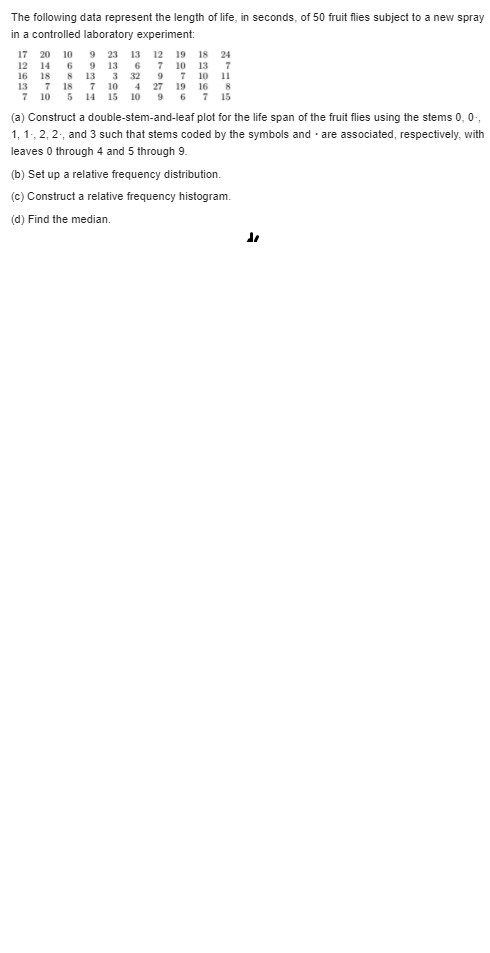
Compute the sample variance and standard deviation for the water absorbency data of Exercise 1.2 on page 13. Reference: Exercise 1.2 According to the journal Chemical Engineering, an important property of a fiber is its water absorbency. A random sample of 20 pieces of cotton fiber was taken and the absorbency on each piece was measured. The following are the absorbency values: 18.71 21.41 20.72 21.81 19.29 22.43 20.17 23.71 19.44 20.50 18.92 20.33 23.00 22.85 19.25 21.77 22.11 19.77 18.04 21.12 (a) Calculate the sample mean and median for the above sample values. (b) Compute the 10% trimmed mean. (c) Do a dot plot of the absorbency data. (d) Using only the values of the mean, median, and trimmed mean, do you have evidence of outliers in the data?\f\f\fThe following data represent the length of life, in seconds, of 50 fruit flies subject to a new spray in a controlled laboratory experiment: 17 20 10 23 13 12 19 18 24 12 13 16 10 13 18 10 19 16 7 14 15 10 15 (a) Construct a double-stem-and-leaf plot for the life span of the fruit flies using the stems 0, 0, 1, 1, 2, 2, and 3 such that stems coded by the symbols and . are associated, respectively, with leaves 0 through 4 and 5 through 9. (b) Set up a relative frequency distribution. (c) Construct a relative frequency histogram. (d) Find the median
Step by Step Solution
There are 3 Steps involved in it

Get step-by-step solutions from verified subject matter experts